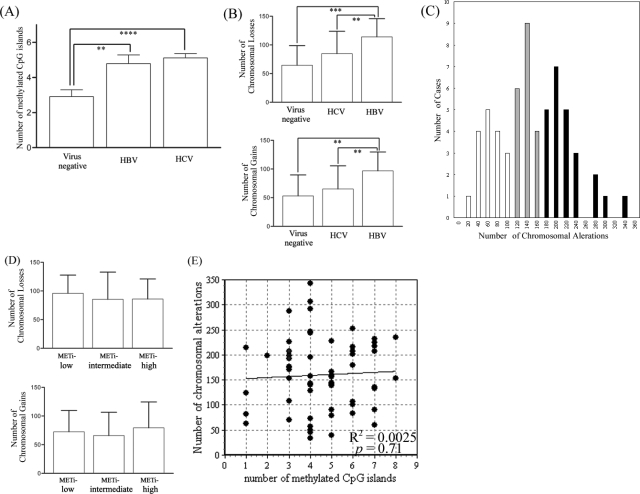
Figure 2.
Aberrant CpG island hypermethylation and chromosomal structural alteration in HCC. A: Correlations between the types of hepatitis virus and the frequencies of CpG island hypermethylation. The y axis indicates the numbers of methylated CpG islands out of nine investigated loci. **P < 0.01, ****P < 0.00001. B: Correlations between the types of hepatitis virus and the extent of chromosomal loss (top) and gain (bottom). The y axis indicates the number of chromosomal losses or gains out of 800 investigated loci. **P < 0.01, ***P < 0.0001. C: Histogram of the frequency of chromosomal structural alterations in HCC. The x axis and the y axis indicate the numbers of chromosomal alterations out of 800 investigated loci and the numbers of cases out of 60 HCCs, respectively. The mean number of chromosomal alterations was 160.2 and the SD was 71.8. The black bars, gray bars, and white bars indicate CIN-positive, -intermediate, and -negative HCCs, respectively. D: Correlations between METi status and the extent of chromosomal loss (top) and gain (bottom). The y axis indicates the number of chromosomal losses or gains out of 800 investigated loci. E: Scatter plot for the numbers of methylated CpG islands out of nine investigated loci (x axis) and the numbers of chromosomal alterations out of 800 investigated loci (y axis). The regression line was determined by simple linear regression analysis. R2, coefficient of determination. P value was calculated by analysis of variance.

