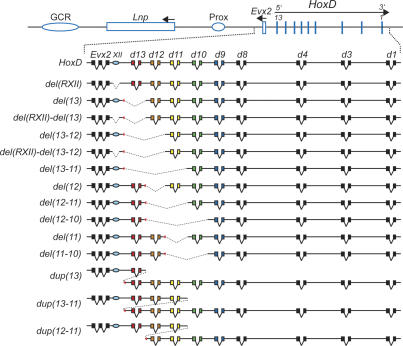
Figure 2.
Stocks of mutant mice used in this study with, at the top, a drawing of the wild-type HoxD cluster. Posterior Hoxd genes are depicted by using a color code, from Hoxd13 in red, to Hoxd9 in blue. The position of conserved RXII is shown by the light-blue oval. The mutant strains used in this work are listed below. Deleted segments are shown by broken lines, whereas duplicated loci are indicated by the same color code. Breakpoints are shown as red triangles.

