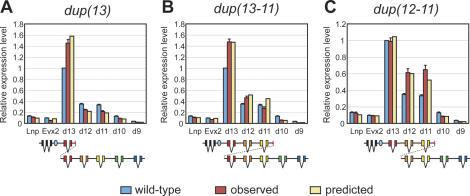
Figure 6.
Duplication alleles. Observed (red) and predicted (yellow) gene expression levels in three duplications. Wild-type levels (light blue) are shown on each panel for comparison. (A) dup(13). (B) dup(13-11). (C) dup(12-11). In all cases, the expression of duplicated loci was less than twice the wild-type level, and genes located 3′ of the duplication were down-regulated, highlighting the importance of gene rank. Hoxd13 expression remained unaffected by the duplication of Hoxd12 and Hoxd11, whereas duplications including Hoxd13 lead to a decrease in Evx2 transcription. The predictions of the model matched the observed values, with the exception of Evx2 down-regulation in dup(13) and dup(13-11), underestimated by the model. Blue ovals are as in Figure 5.

