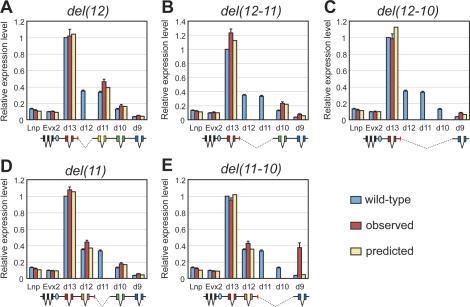
Figure 7.
Deletions excluding Hoxd13. Observed and predicted gene expression levels in five “internal deletions.” Colors and schemes are as in Figure 6. (A) del(12). (B) del(12-11). (C) del(12-10). (D) del(11). (E) del(11-10). All deletions lead to increased expression of 3′-located genes, whereas genes located 5′ of the deletions were less affected. The observed levels are in good agreement with predicted values, with the exception of the strong up-regulation of Hoxd9 in del(11-10), not accounted for by the model. Blue ovals are as for Figure 5.

