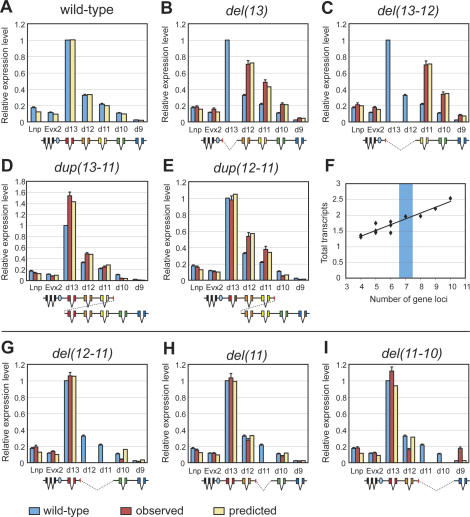
Figure 8.
Hoxd gene regulation in the developing genital tubercle. The same model structure was applied to investigate Hoxd gene regulation in the genital eminence. The various parameters of the model were optimized using expression values observed in the genital bud in all configurations, except for internal deletions (see the text). (A) In the wild-type situation, quantitative collinearity in the genital bud was similar to what was observed in presumptive digits. (B–E) The 5′ deletions and duplications induced comparable regulatory reallocations in the genital bud, as compared with digits. (B) del(13). (C) del(13-12). (D) dup(13-11). (E) dup(12-11). (F) As in the case of digits, the overall transcription level correlated with the number of transcription units at the locus. In all cases, the observed expression levels were in good agreement with the predictions of the model. (G–I) In contrast, the model could not account for the expression levels observed following internal deletions. For instance, del(12-11) (G) and del(11) (H) lead to a decreased expression of Hoxd10, and del(11-10) leads to a down-regulation of Hoxd12 (I). As in developing digits, del(11-10) elicited a strong increase in Hoxd9 transcription, which was not predicted by the model. Blue ovals are as in Figure 5.

