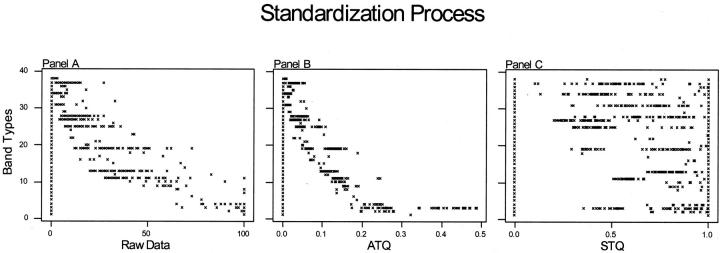
Figure 4.
Illustrating the standardization process. A: Raw data, where the band-type axis represents band characterization determined by ±5% (Rf) tolerance and the raw data axis is the unstandardized trace quantity of each band. B: Adjusted trace quantities (ATQ), where each isolates trace values (raw data) for all bands produced by that isolates is divided by the sum of those values (standardize for gel loading). C: Standardized trace quantities, where each ATQ of all isolates is divided by the maximum respective ATQ. Note that hierarchy of band intensity is removed while retaining a standardized form of band intensity. Note also the bimodal distributions in the STQ values, particularly band types 19 and 25.

