Figure 1.
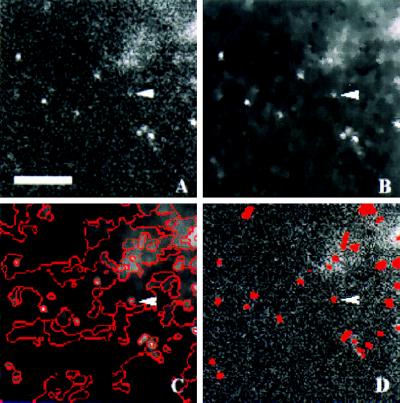
Detection of vesicles in human chromogranin B–GFP-transfected Vero cells. After release of secretion, 40 images were recorded with a time-lapse of 0.5 sec. (A) Unprocessed image at initial time step. (B) After diffusion filtering, the noise level is considerably reduced without loosing significant object information. (C) After edge detection within the filtered image, edges are connected to build regions. (D) Based on the induced region, neighborhood graph vesicles are detected as regions with locally maximal intensity. For comparison, the unprocessed image (A) is overlaid with the detected vesicles false-colored in red. Of note, even weak and noisy vesicle signals (denoted by arrow head) are readily detected. (Bar = 5 μm.)

