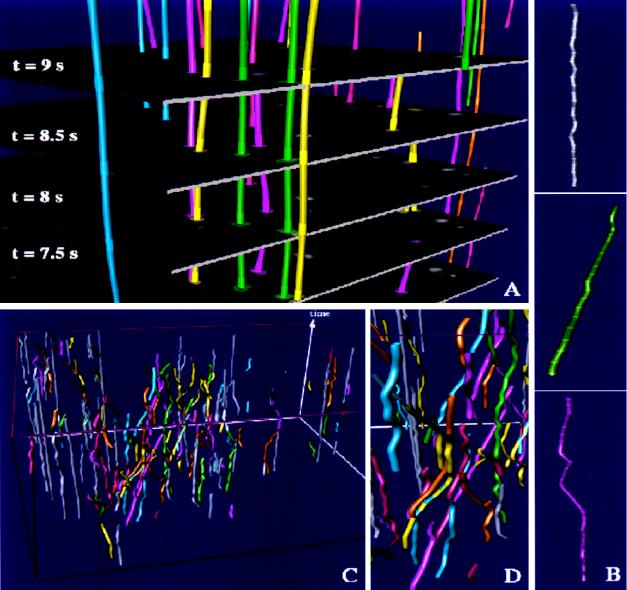
Figure 2.
Time–space tracking of vesicles for the cell shown in Fig. 1. (A) Tracking and interpolation between consecutive time steps is demonstrated for 4 of 40 sections at indicated time steps. The sequence of original images is embedded into the continuous time–space where time evolves along the vertical axis. The highlighted rings on trajectories correspond to intersections of the image sequence with interpolated trajectories. (B) After time–space interpolation, trajectories were categorized into three classes: stationary (Top), unidirectional (Middle), and bi-directional (Bottom). (C) Visualization of selected trajectories within the Open Inventor Scene Viewer. Fast moving trajectories are color-encoded whereas stationary trajectories are visualized in gray. For display reason, only 20% of the stationary trajectories are shown. (D) Within the scene viewer, the user may view the time–space from different directions and may zoom and assign different colors and textures (not shown) to selected trajectories. A movie showing the multidimensional visualization of trajectories is published as supplemental data on the PNAS web site (www.pnas.org).

