
Figure 6.
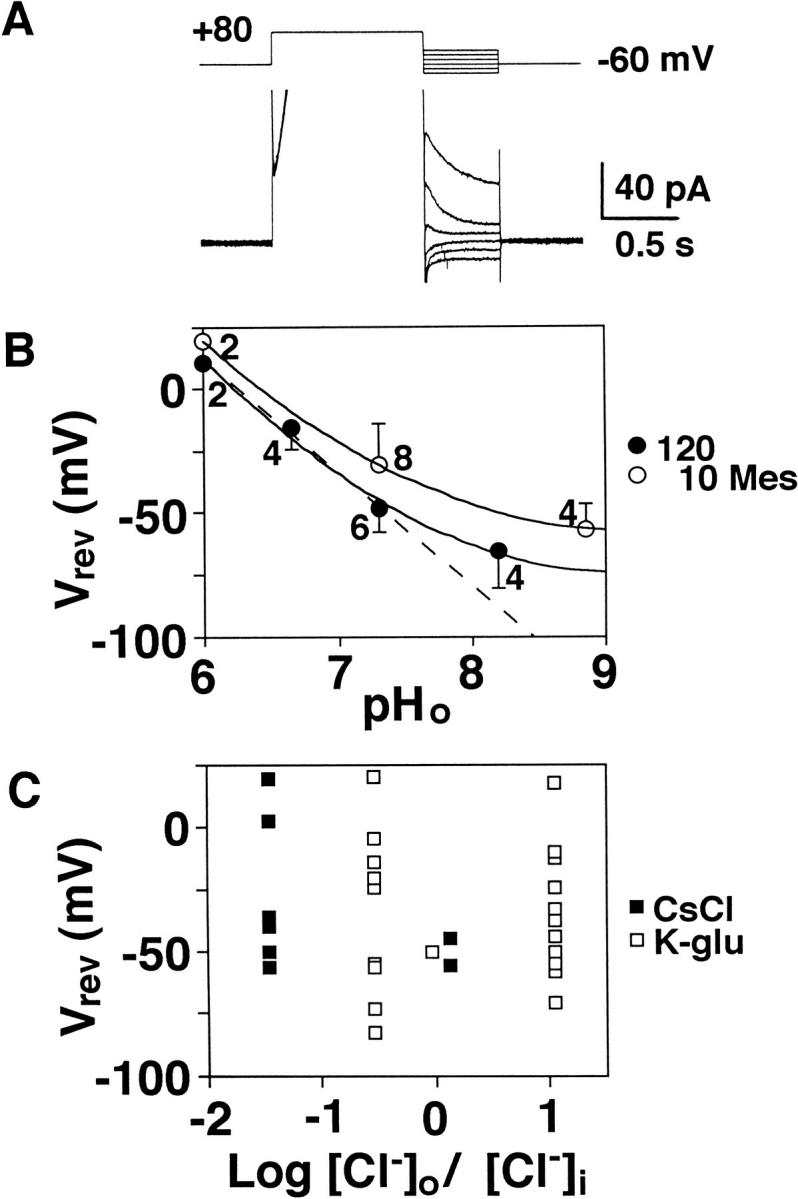
Reversal potential of heating-activated outward current. (A) Tail currents after a depolarization prepulse (+80 mV) at pHp 5.5. The outward current evoked by the prepulse is truncated. (B) Relationships between pHo and the reversal potential (Vrev) estimated from tail currents following a prepulse of either +80 or +100 mV (1 s). Open and closed circles represent mean and SD of data recorded with 10 and 120 mM Mes. The solid curves are fitted by eye and the dotted line, a linear regression for data at pHo 6.0, 6.7, and 7.3 with 120 mM Mes. Figures attached with data indicate the number of cells. (C) Vrev plotted against the ratio between extracellular and intracellular Cl− concentrations ([Cl−]o/[Cl−]i) on a semilogarithmic scale. Open and closed squares represent data recorded with K-glutamate and CsCl in the internal solution, respectively. B and C were obtained from the same data. The external medium was same (standard Ringer) except for pHo.