
Figure 5.
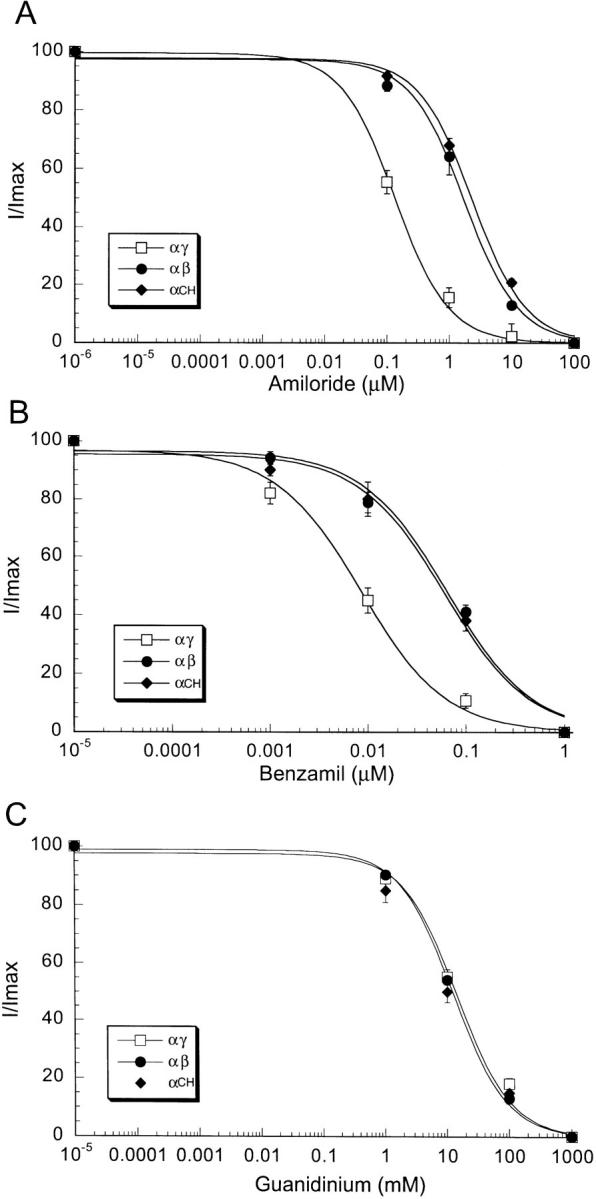
Dose-response curves of inhibition of Na+ currents by amiloride (A), benzamil (B), and guanidinium (C) of oocytes co-injected with α and γ cRNAs (□), α and β cRNAs (•), and CH3 and α cRNAs (♦). Similar response to CH3 was obtained with chimera CH4. Measurements were obtained with the two-electrode voltage clamp technique in the presence of 150 mM Na+ gluconate in the bath and at −100 mV membrane potential. Data points represent the mean of 10 different oocytes. Vertical bars represent the SEM.