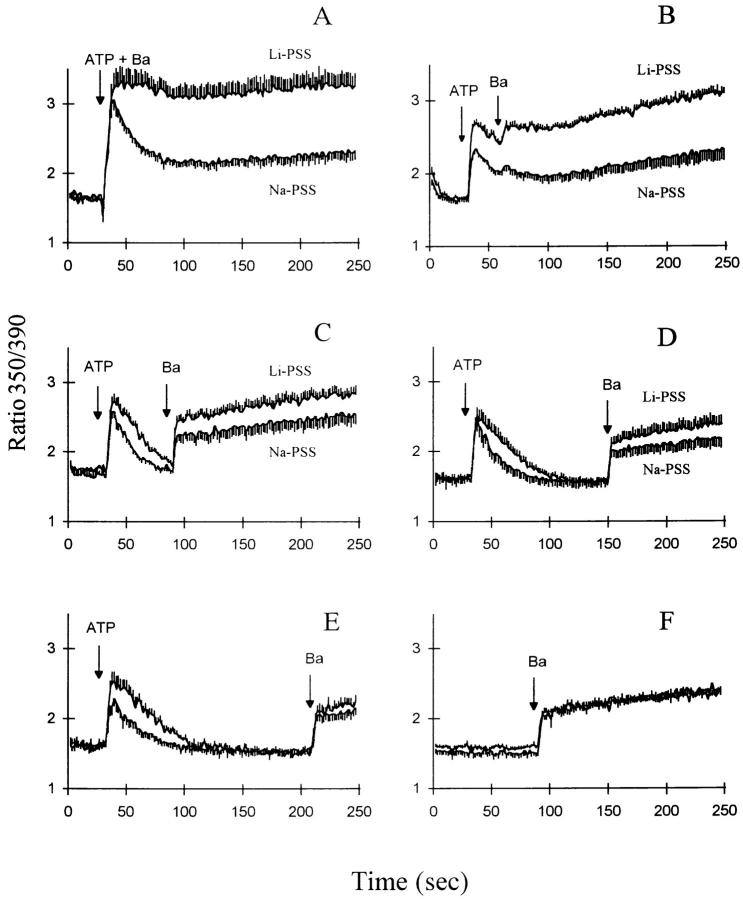
Figure 4.
ATP and Ba2+ influx in CK1.4 cells. CK1.4 cells were loaded with fura-2, preincubated for 1 min in Na-PSS + 1 mM CaCl2 and diluted 30-fold into cuvettes containing either Li- or Na-PSS plus 0.3 mM EGTA. Fura-2 fluorescence was monitored with alternate excitation at 350 and 390 nm. ATP (0.3 mM) was added at 30 s in each panel and BaCl2 (1 mM) was added at increasing intervals following ATP, as indicated; in A, ATP and BaCl2 were added simultaneously. (n = 4–6 [A, B]; 3–4 [D, E] and 6–8 [C]).

