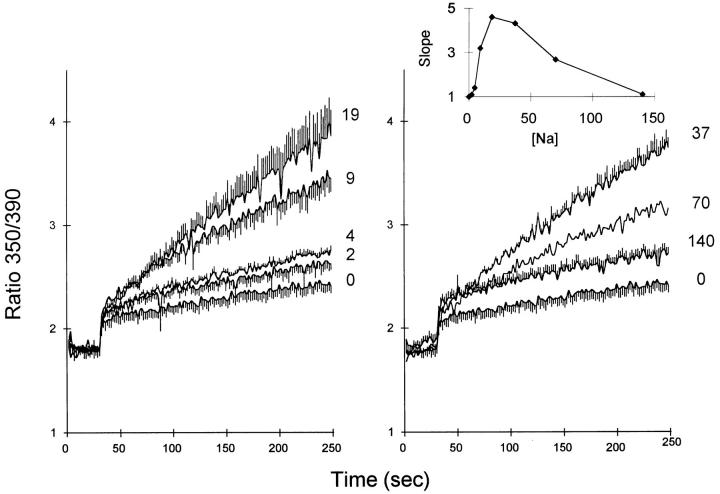
Figure 5.
Ba2+ influx in gramicidin-treated CK1.4 cells. Cells were loaded with fura-2, washed, and preincubated in K-PSS + 1 mM CaCl2, centrifuged, and resuspended in mixtures of K-PSS + Na-PSS that yielded the final Na+ concentrations (in mM) indicated next to each trace; each solution also contained 0.3 mM EGTA. Gramicidin (1 μM) was added immediately after the cells and 1 mM BaCl2 was added at 30 s. (n = 3–5; for 70 mM Na+, n = 2). Inset: Dependence of the rate of Ba2+ influx on [Na+]. The slopes of the traces at each [Na+], normalized to that for [Na+] = 0, are plotted on the ordinate scale.

