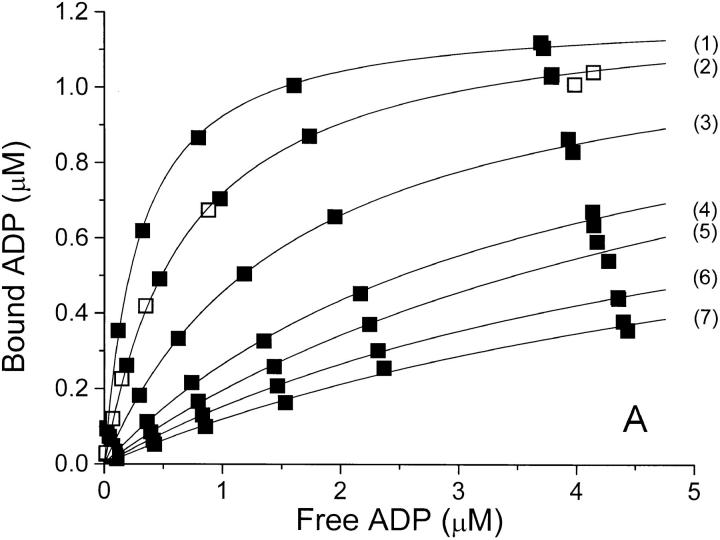
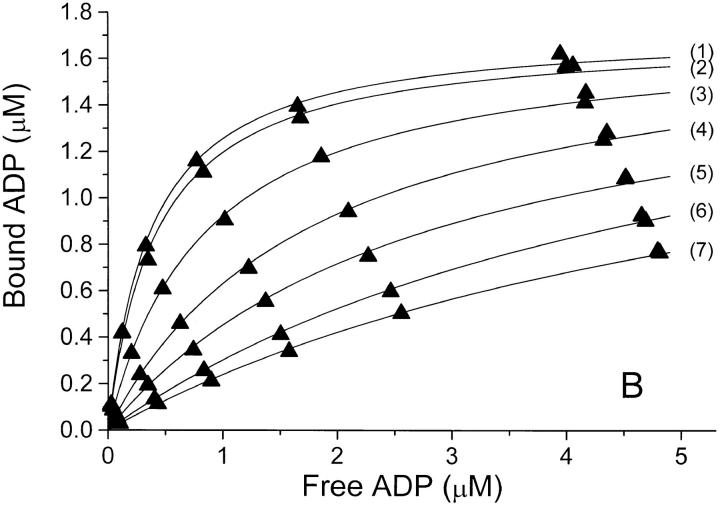
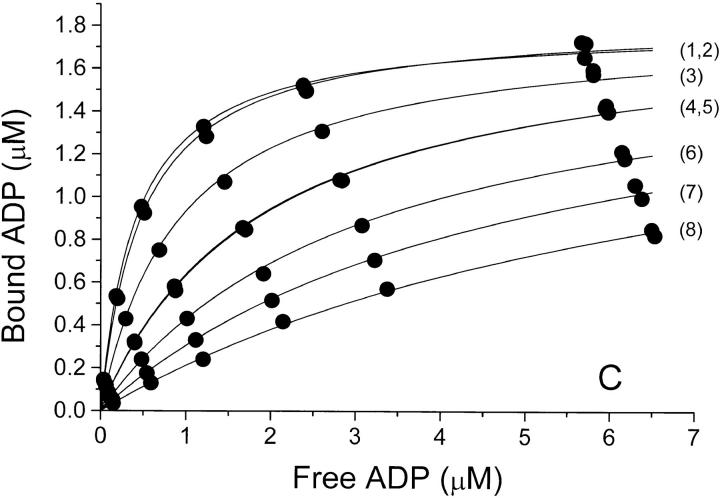
Figure 1.
Binding isotherms at 0°C and pH 7.7 for binding of ADP to Na,K-ATPase in (A) NaCl-, (B) Na2SO4-, and (C) NaNO3-solutions of increasing concentration. In each panel, the anion concentration (and thereby the ionic strength) increases from the top-curve (1) to the bottom-curve (7 or 8), see Table I. In panel A is also shown a binding isotherm in 100 mM Na-acetate (□). The concentrations of bound and free ADP are those in the assay solutions, so that the Bmax value in each series depends upon the (constant) concentration of enzyme-preparation used for the assays of that series—for further details see materials and methods. The relative error on F due to pipetting and counting is ±2% and that on B is about ±3% (see also the double determinations at the highest B values). The curves are the best fit by nonlinear regression (data weighted by B−2, see Jensen et al., 1984) to a one-site model: B = Bmax · F/(K diss + F), and the values for Bmax and K diss derived from these data are given in Table I.


