Figure 6.
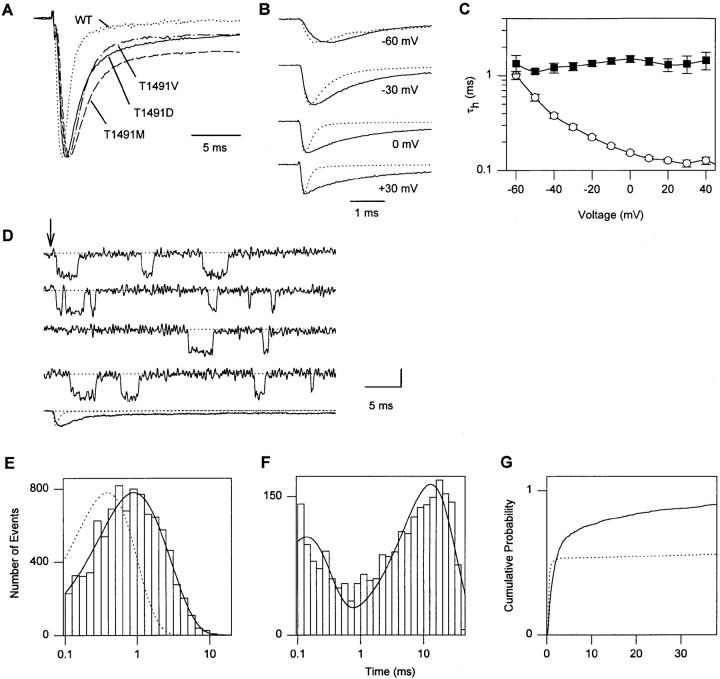
Effects of mutations of T1491. (A) Two-electrode voltage-clamp recordings from oocytes expressing WT and mutant channels. Normalized current traces in response to depolarizations to 0 mV for the indicated mutants are shown. Panels B–G show experiments with mutant T1491M. (B) Averaged current traces from cell-attached macropatches in response to pulses to the indicated potentials from a holding potential of −140 mV. Each trace is an average of normalized traces from different experiments for WT (dotted line, n = 13 experiments) and T1491M (solid line, n = 4). (C) Voltage-dependence of macroscopic inactivation. τh was determined from single exponential fits to the current decay in macropatch experiments from WT (○; n = 4) and T1491M (▪; n = 3) Na+ channels studied in the same batch of oocytes. (D) Single-channel records and an ensemble average (last trace) from a cell-attached patch containing a single channel. The dotted ensemble average is WT normalized for comparison. The arrow indicates the beginning of 40-ms depolarizations to −20 mV from a holding potential of −140 mV. The vertical calibration bar is 1 pA for single-channel traces and 0.5 pA for the ensemble average. (E) Open time histogram at −20 mV. Three patches containing one to two channels each were used for open time analysis. The solid line is a fit to the sum of two exponentials to the log binned data. The time constants from the fit are 1.45 and 0.565 ms (Table IV). The dotted line is a single exponential with the WT time constant. Mean open times for individual T1491M patches at −20 mV were 1.02, 0.96, and 1.23 ms. (F) Histogram of closed times excluding first latencies at −20 mV. Only single-channel patches were used for closed time analysis. The solid line is the fit of the sum of two exponentials to the log binned data. The time constants derived from the fit are 0.13 and 12.89 ms (Table IV). (G) Cumulative first latency distributions for WT (dotted line) and T1491M (solid line) at −20 mV. Distributions were corrected for the channel number (Patlak and Horn, 1982). Data are from patches with one to two channels (T1491M) or two channels (WT). Parameters for fits to the sum of two exponentials (see materials and methods) are shown in Table V.

