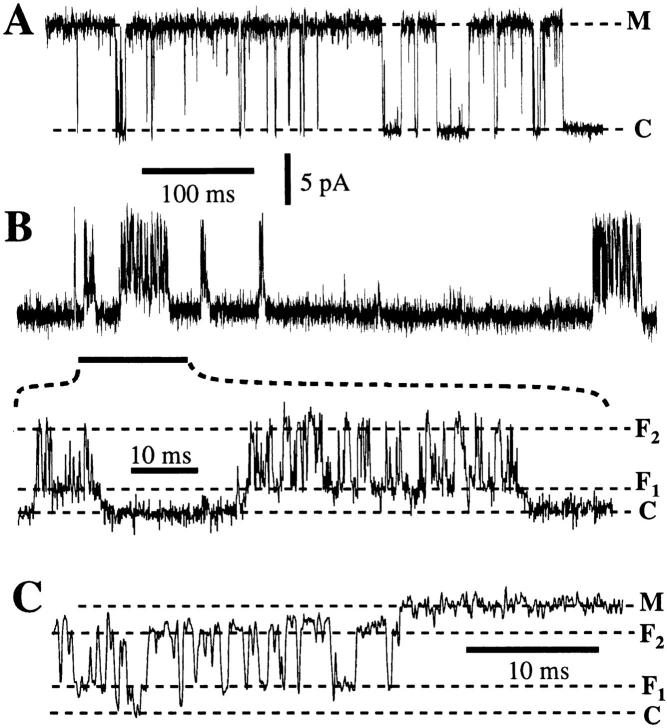
Figure 11.
Typical current trace of an IP3R channel (A) in the normal kinetic mode (B) in the flicker kinetic mode with bursts of activities and (C) in a transition from flicker mode to the normal mode without closing. The dashed lines indicate the current levels of the various conductance states. V app was 50 mV. Data were digitized at 12.5 kHz and filtered at 5 kHz.

