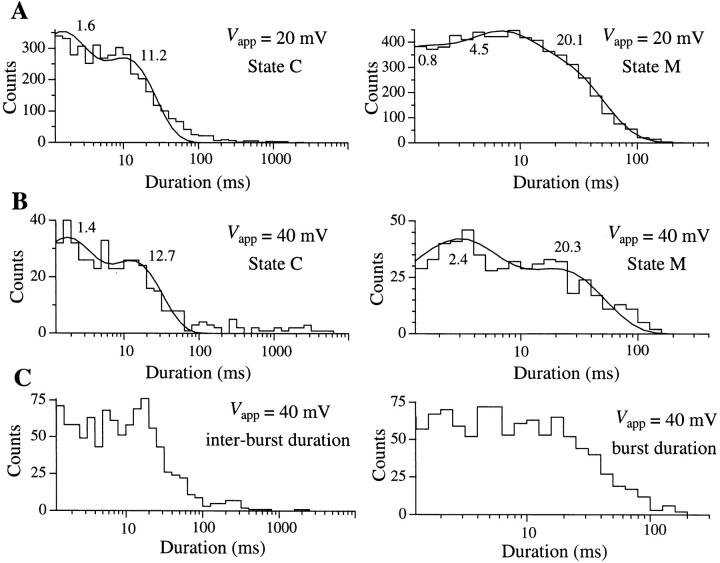
Figure 5.
Dwell time histograms for the closed state C and open state M of the IP3R at V app = (A) 20 and (B) 40 mV, respectively. Only states C and M were observed in the single-channel current records used for this analysis. 6 records with total duration of 139.1 s were used for A, and 1 record with duration of 42.8 s was used for B. The smooth curves are theoretical probability density functions consisting of two exponentials fitted to the histograms by the maximum likelihood method (Sigworth and Sine, 1987). The time constants for the exponentials fitted are labeled in ms beside the corresponding peaks in the curves. (C) Duration histograms of inter-burst closed state and the activity bursts of an IP3R channel in the flicker mode at V app = 40 mV. The activity burst duration was defined as the interval between the departure of the channel from the closed state into either one of the flicker states (F1 or F2) and its subsequent return to the closed state for a period longer than 1 ms. Data were digitized at 2 kHz, filtered at 800 Hz and analyzed using MacTac software with channel dwell time corrected for the filtering (Colquhoun and Sigworth, 1995).

