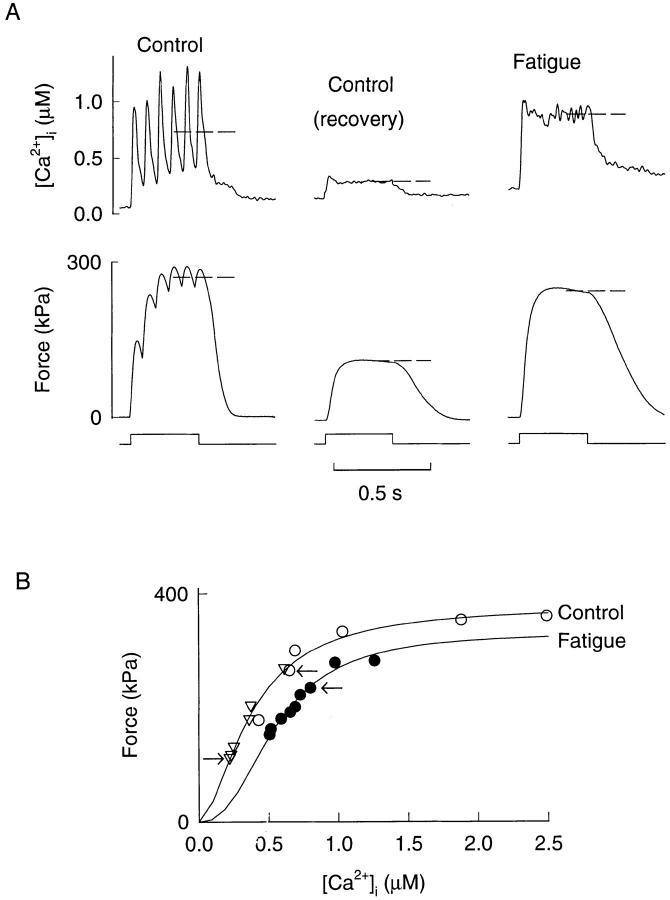
Figure 3.
[Ca2+]i-force relations of a type 1 fiber in control and during fatigue. (A) Examples of tetanic [Ca2+]i and force records used to construct [Ca2+]i-force curves. Dashed lines indicate how measurements were performed. The “Control” tetanus was produced at a reduced stimulation frequency (15 Hz) before fatiguing stimulation, while the “Control (recovery)” tetanus was produced at 20 min after the end of fatiguing stimulation. Periods of stimulation are indicated below force records. Curves in B represent least square fits of Eq. 1 to data-points obtained in control (○, reduced stimulation frequency; ▿, during recovery after fatiguing stimulation) and during fatigue (•), respectively. Arrows indicate data-points from the tetani shown above.

