
Figure 4.
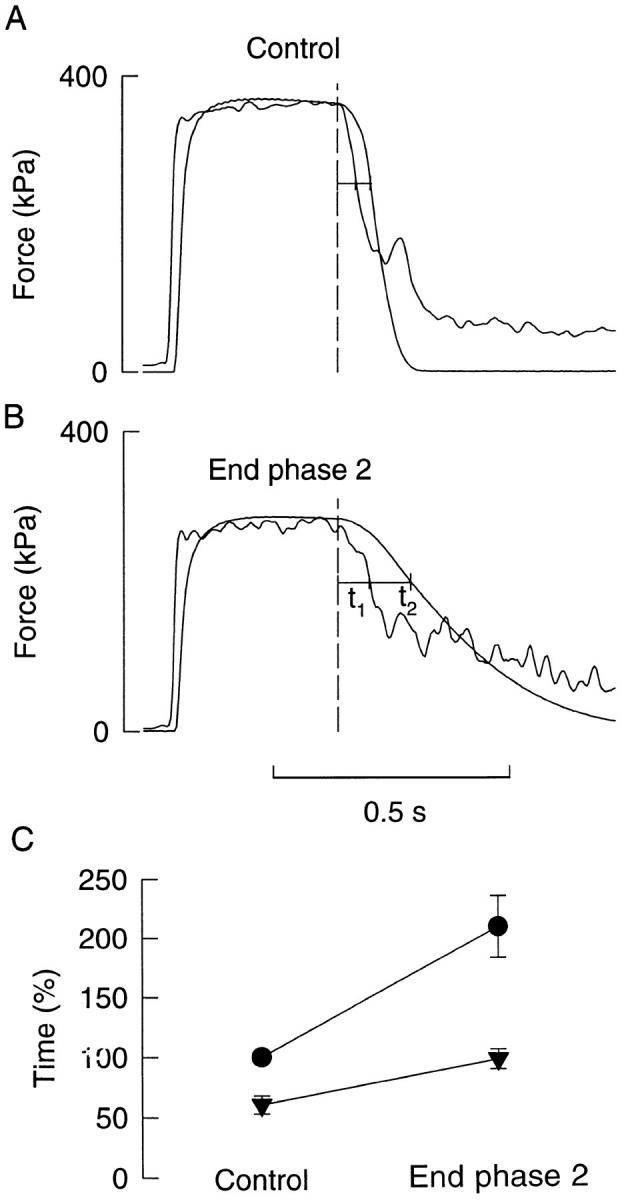
Real and Ca2+-derived force of Xenopus fibers in control and at the end of phase 2. Records obtained from a type 1 fiber in control (A) and at the end of phase 2 (B). Records with higher noise level represent Ca2+-derived force. Dashed lines indicate end of tetanic stimulation. Measurements were performed at 70% of the tetanic force (horizontal lines); t1 represents the calcium component, and t2 represents the cross-bridge component of relaxation. C shows collected data (mean ± SEM; n = 7) of the relative time of real force relaxation (t1 + t2, •) and relaxation of the calcium component (t1, ▾). The relaxation time of real force in control was in each experiment set to 100%.