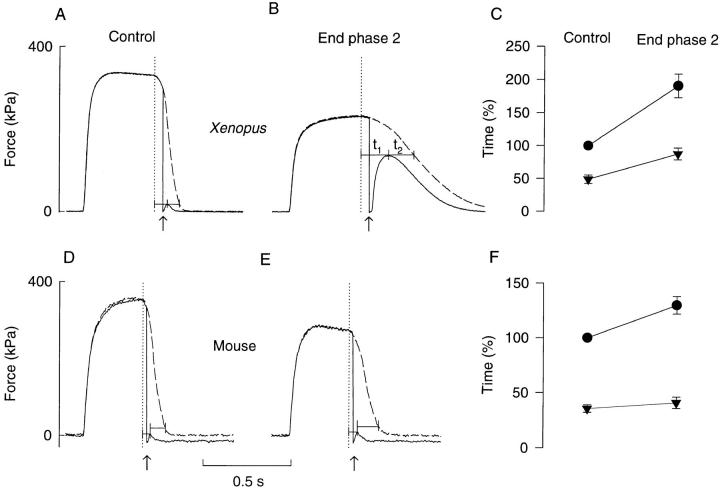
Figure 6.
Releases during relaxation in a Xenopus fiber (A and B) and in a mouse fiber (D and E). Records were obtained in control (A and D) and at the end of phase 2 (B and E). Force records with full lines were obtained with the release and records with dashed lines in a preceding tetanus without release. Upward arrows show time of releases; the amplitude of releases was 200 μm for the Xenopus fiber and 70 μm for the mouse fiber. Measurements were performed from the end of stimulation (dotted lines) to the time of peak force after the release (t1) and then to the time when the same relative force was produced in the preceding tetanus without release (t2). Note that in the mouse fiber the shortening step resulted in a reduction of the resting force, and measurements were therefore performed at somewhat different absolute force levels. Mean data of the time of real force relaxation (t1 + t2, •) and the time to peak force after the release (t1, ▾) obtained in Xenopus fibers (C; n = 6) and mouse fibers (F ; n = 4). The relaxation time of real force in control was in each experiment set to 100%.

