
Figure 7.
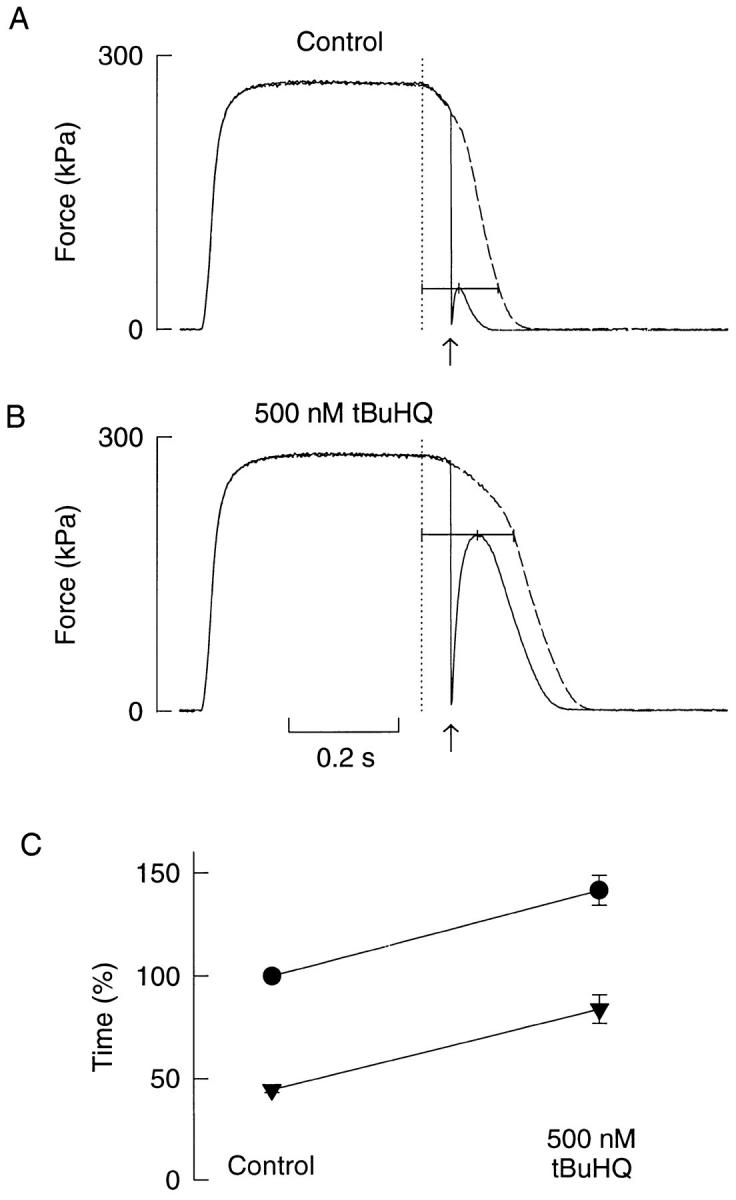
Releases during relaxation in a Xenopus fiber where the SR Ca2+ uptake was inhibited by tBuHQ. Force records with (full lines) and without (dashed lines) releases before (A) and after 10-min exposure to 500 nM tBuHQ (B). Dotted lines show end of tetanic stimulation; upward arrows indicate the time when a 250 μm release was performed. Measurements indicated by horizontal lines; observe that the time to peak force after the release (i.e., the calcium component) increased in tBuHQ, whereas the time from the peak to the same real force level (i.e., the cross-bridge component) remained constant. C shows mean data (n = 6) of the relative relaxation time of real force (•) and the calcium component (▾) from control and tBuHQ.