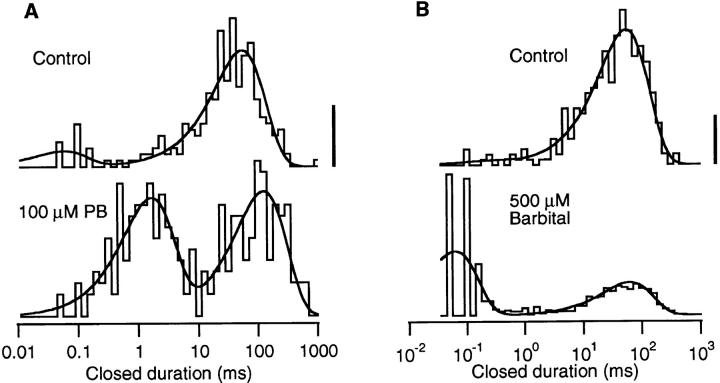
Figure 2.
Closed duration histograms compiled from the same two experiments exemplified in Fig. 1. The solid lines are fits to the two-exponential probability distribution function. The long component represents the closed time between openings of different channels in the patch. The brief component represents gaps within a burst of activity of a single channel. Gaps are rarely seen in control recordings but are frequently seen in the presence of a barbiturate. The vertical calibration bar represents 10 events in control (linear scale), see below for vertical scaling of barbiturate histograms. 0.2 μM ACh, −100 mV. (A) Control: 236 events, gap duration = 66 μs (fraction = 0.12); long duration 63 ms. 100 μM PB: 251 events, gap duration = 1.8 ms (0.48); long duration = 140 ms. Calibration bar = 6 events. (B) Control: 509 events: gap duration = 35 μs (0.07); long duration = 51 ms. 500 μM Barb: 632 events: gap duration = 50 μs (0.64); long duration = 66 ms, calibration bar = 50 events.

