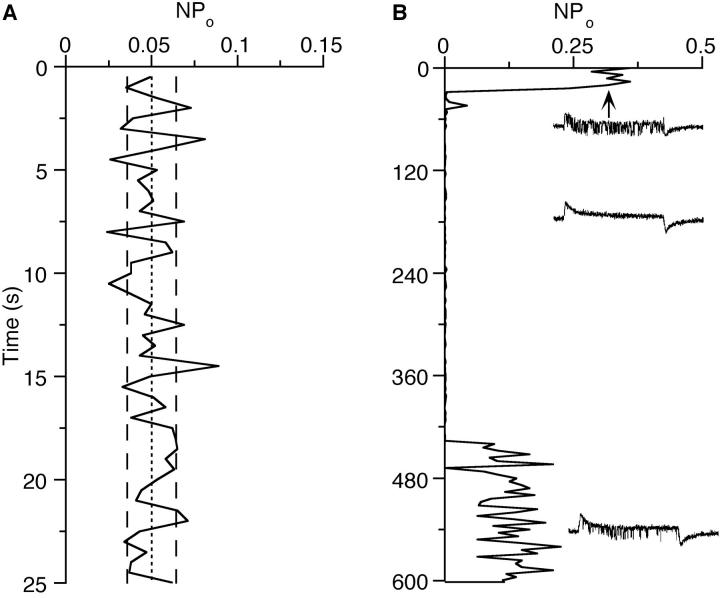
Figure 11.
Ca channels in cell-attached patches do not inactivate but show clearly distinguishable periods of activity and inactivity. (A) The relative open probability (NPo) determined from 0.5-s segments during steady depolarization to +50 mV. N is the number of channels in the patch. The lines indicate mean NPo (dotted) and ± SD (dashed), respectively. (B) In another patch, NPo was determined from voltage jumps (70 mV depolarizing jumps of 100-ms duration every 4 s) from the resting potential, which were recorded over a period of 10 min. During the first 30 s two channels were active, while only one channel was active during the last 3 min of the recording. Representative sample traces from the beginning, middle, and end of the recording are shown as insets.

