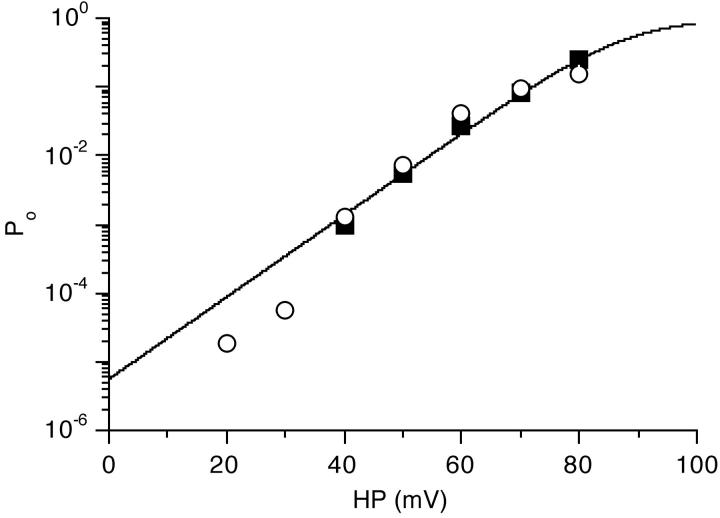
Figure 8.
Open probability of the Ca channel increases strongly with depolarization. Plot of Po as a function of the membrane potential in a patch with one active channel. Po values were determined during steady depolarization (open circles) or from voltage steps (closed squares) to the indicated potentials. The curve through the data points is a fit to a Boltzmann curve with Po = 1/{1+ exp [(V h − HP)/k]} where V h is the depolarization necessary for half-maximal channel activation (+88 mV), HP the patch potential (relative to rest), and k the depolarization necessary for an e-fold change in Po (+7.2 mV). The values for steady 20 and 30 mV depolarization are not included in the fit (see results).

