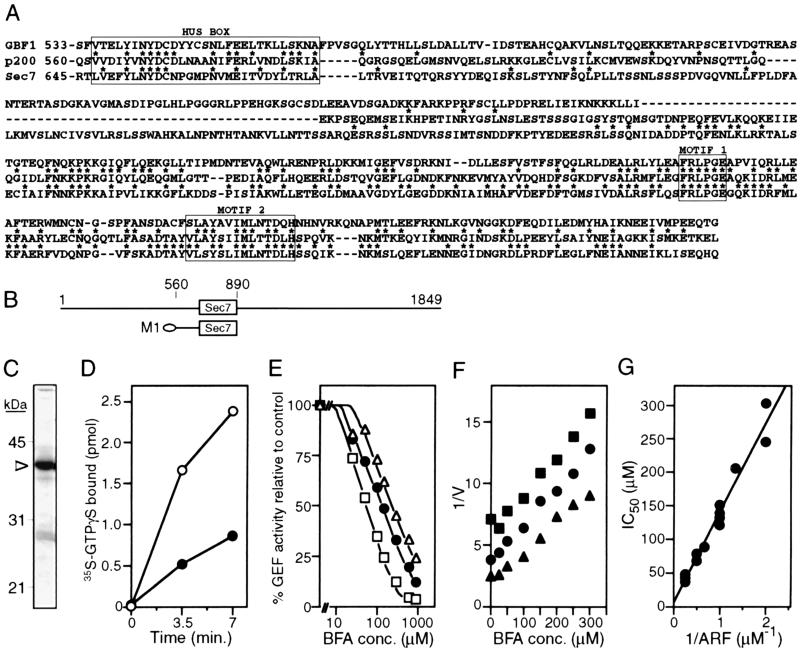
Figure 4.
Guanine nucleotide exchange activity of fragment M1. (A) Amino acid sequence alignment of the region extending from the homology upstream of Sec7 box to the end of the Sec7 domain. *, identical residues on pairwise comparison between human p200 and either human GBF1 or yeast Sec7p. The Sec7 domain corresponds to the bottom half of the sequence. (B) Schematic representation of fragment M1 in reference to full-length protein. The ellipse at the left side symbolizes the N-terminal hexahistidine tag. (C) Partial purification of M1. Dialyzed sample (1 μg) was resolved by SDS/PAGE and was visualized with Coomassie staining. The arrowhead marks the 39-kDa M1 protein. (D) Exchange activity toward a mixture of bovine ARF1 and ARF3. Assays were performed in the presence of 1 μM ARF and 20 nM M1, as described in Materials and Methods. Open circles, no BFA; filled circles, 300 μM BFA. (E) BFA titration at three different ARF concentrations. The exchange rate after 8 min at the indicated BFA concentrations (0, 25, 50, 100, 150, 300, 600, and 900 μM) was measured as in D in the presence of 0.5 μM (▵), 1 μM (●), or 4 μM (□) ARF, with the exception that the concentration of M1 was reduced to 10 nM. Results are expressed as percent of value measured in absence of BFA for each ARF concentration. Similar IC50 values were obtained with 4-min reactions. (F) Dixon plots [1/v vs. (BFA)] of BFA titrations. The extent of exchange after 2 min at the indicated BFA concentrations (0, 25, 50, 100, 150, 200, 250, and 300 μM) was measured in duplicate as in D. Results with three ARF concentrations are shown: 0.75 μM (■), 1 μM (●), and 1.5 μM (▴). This result was reproduced three times. (G) Determination of KI. IC50 values were estimated from Dixon plots of several independent measurements as described in Materials and Methods and were replotted as a function of the inverse ARF concentration.

