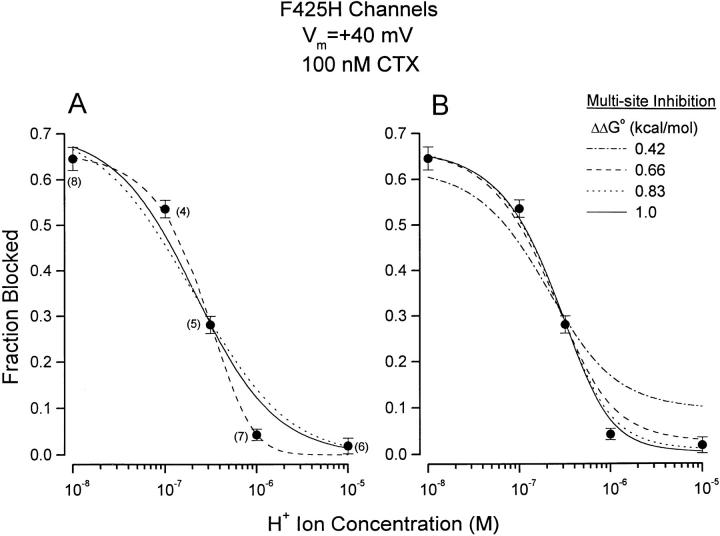
Figure 5.
pH dependence of CTX block of F425H channels. Currents measured at +40 mV. The CTX concentration used was 100 nM. Data are the averages of 4–7 observations and indicated next to the mean values. SEM limits as shown. (A) Solid line: fit of Eq. 1 to data with K d and pK H values of 42 nM and 7.2, respectively. Dotted line: see text. Dashed line: fit of Eq. 2 to data with K d and pK H values of 48 nM and 5.9, respectively. (B) Data as in A. Lines: fits of Eq. 3 to data. See text for details.

