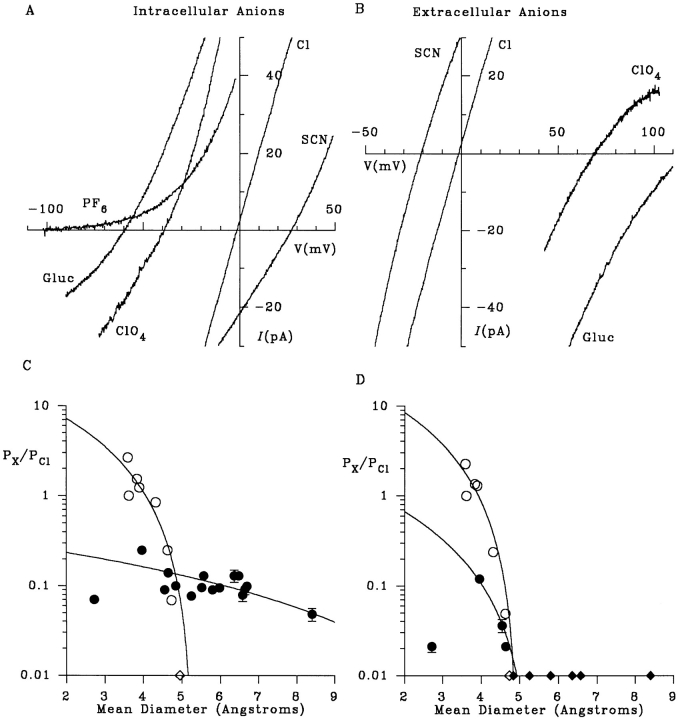
Figure 1.
Selectivity of macroscopic CFTR currents. (A) Example I-V curves recorded with NaCl in the extracellular (pipette) solution and NaCl, NaSCN, NaClO4, Na · gluconate (Gluc) or NaPF6 (hexafluorophosphate) in the intracellular (bath) solution. (B) Example I-V curves with NaCl in the intracellular solution and NaCl, NaSCN, NaClO4, or Na · gluconate in the extracellular solution. (C and D) Apparent permeability ratios for different intracellular (C) or extracellular (D) ions (P X/P Cl; taken from Table I) as a function of mean unhydrated ionic diameter. Open symbols represent lyotropic (weakly hydrated) ions (from left to right: SCN−, Cl−, NO3 −, Br−, I−, ClO4 −, benzoate, PF6 −), and filled circles represent kosmotropic (strongly hydrated) ions (from left to right: fluoride, formate, acetate, propanoate, pyruvate, methane sulfonate, glutamate, isethionate, gluconate, glucoheptonate, glucuronate, MES, ga- lacturonate, HEPES, TES, lactobionate) (see Collins, 1997). Ions that were not measurably permeant are shown as diamonds on the abscissa for display purposes only. In each case, the data have been fitted by Eq. 2 (see methods), giving estimates of the functional pore diameter of 5.3 (C, ○), 13.8 (C, •), 4.9 (D, ○) and 5.3 (D, •) Å.

