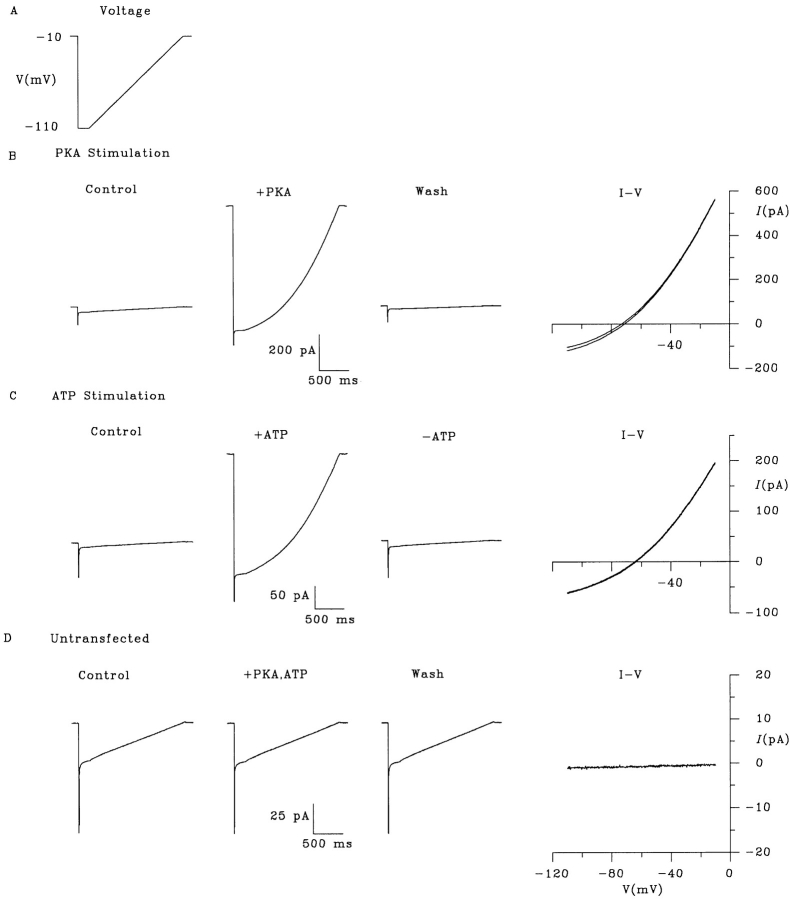
Figure 3.
Raw current traces illustrating permeation by intracellular gluconate under biionic conditions. (A) Voltage ramp protocol used to examine gluconate permeability. (B) Current traces recorded in response to the voltage protocol shown in A, in the presence of ATP (Control), after CFTR stimulation by addition of PKA, and after removal of PKA and ATP (Wash). The resulting I-V curves constructed by subtraction of either of the two leak currents illustrated from the current recorded in the presence of PKA are shown on the right (I-V); these two I-V curves are practically superimposable. (C) Current traces recorded in response to the same voltage protocol, in the presence of PKA (Control), after CFTR stimulation by addition of ATP, and after removal of ATP. As in B, the two resulting indistinguishable I-V curves are shown at right. (D) PKA and ATP do not stimulate any current in patches excised from control, untransfected BHK cells under the conditions used in B and C.

