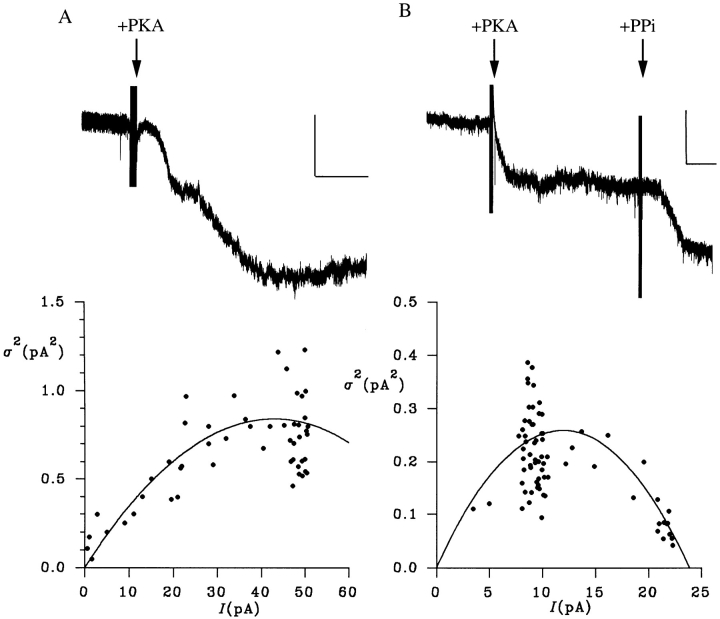
Figure 6.
Estimation of unitary gluconate current from macroscopic gluconate current noise. (A) Slow activation of gluconate current at −50 mV under symmetrical ionic conditions on addition of PKA. The scale bar represents 10 pA and 1 min. Below is shown the relationship between mean gluconate current (I) and current variance (σ2) for this patch, calculated for 5-s subrecords as described in methods. The data have been fitted by Eq. 3 (see methods), giving i = 39.3 fA and n = 2,183. (B) Macroscopic gluconate current under these conditions is further stimulated by addition of 1 mM PPi, and this increase in current is associated with a decrease in current variance. The relationship between I and σ2 for this patch has been fitted by Eq. 3 (see methods), giving i = 43.4 fA and n = 549.

