
Figure 16.
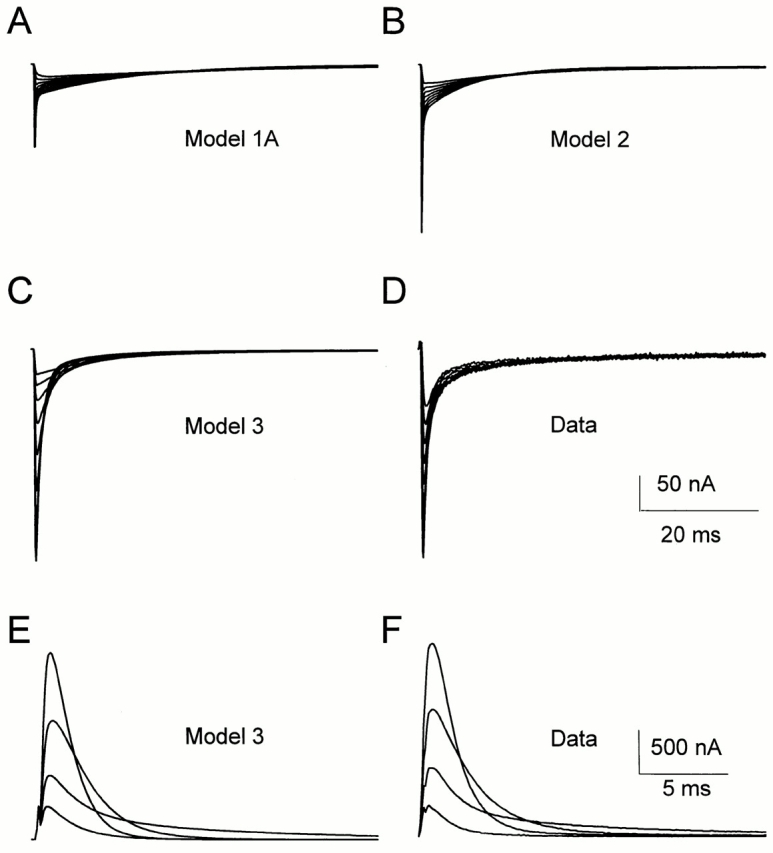
(A–D) OFF gating current evoked by repolarization to potentials from −150 to −70 mV in 10-mV increments, after a 20-ms depolarizing pulse to 20 mV from a holding potential of −90 mV, as predicted by Models 1A (A), 2 (B), and 3 (C), or as recorded experimentally (D). Predicted data and experimental data were generated/sampled at 10 kHz and filtered at 2 kHz. The data were normalized according to the amount of gating charge moving during the depolarizing pulse. (E and F) ON gating current evoked by depolarizations to potentials from −50 to 10 mV in 20-mV increments from a holding potential of −90 mV, as predicted by Model 3 (E) or as recorded (F). Data were generated/ sampled at 10 kHz, filtered at 2 kHz, and normalized to the peak gating current at 10 mV.