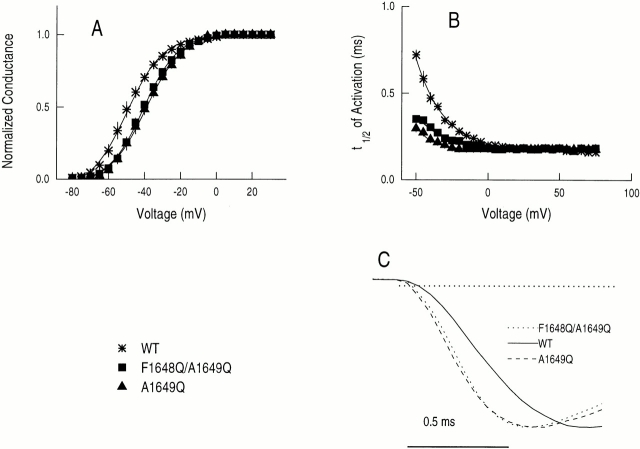
Figure 4.
Effects of mutations on activation. (A) Normalized peak G-V relationship from current–voltage (I-V) curves (not shown) for WT, F1648Q/ A1649Q, and A1649Q channels. Currents were elicited by 45-ms pulses to a range of test potentials as indicated from a holding potential of −120 mV. Each test current (I) was normalized by maximal peak current. Standard error bars are generally smaller than the symbols. Normalized G-V relationship for I-V curves, determined as I/(45 mV − V t), where V t is the test potential and 45 mV is the reversal potential in this study. Normalized conductance was fitted to a Boltzmann relationship and midpoints and slopes were determined from the fitted G-V curves (Table I). (B) Half-time to peak current, t 1/2, vs. test voltage. (C) Activation time course of channels containing the A1649Q and F1648Q/ A1649Q mutations and WT on expanded scale at −40 mV.

