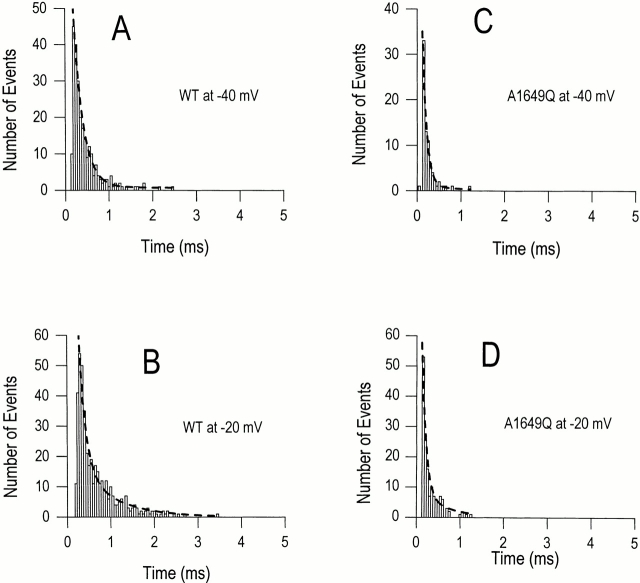
Figure 7.
Analysis of single channel open times. Open-time histograms are displayed for WT and A1649Q at −40 and −20 mV. The open times derive from fits to a single exponential shown as dashed lines. These histograms are one example of nine and six patches for WT and A1649Q, respectively. The time constants are 0.228 ± 0.013, 0.313 ± 0.017, 0.116 ± 0.014, and 0.126 ± 0.031 ms for A–D, respectively.

