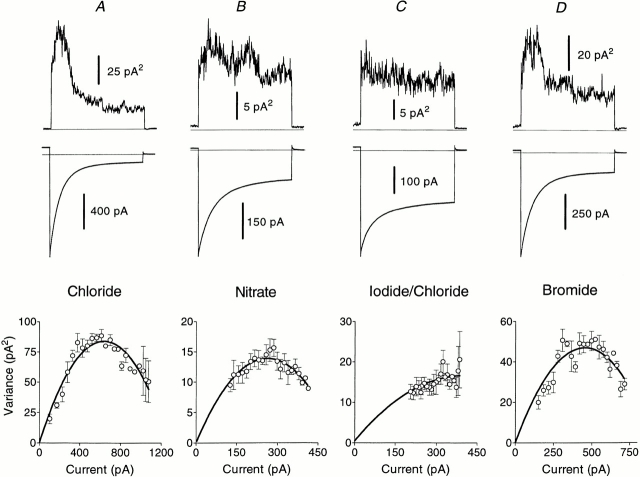
Figure 7.
Nonstationary noise analysis performed on outside-out patches from Xenopus oocytes expressing hClC-1 in the presence of Cl−, NO3 −, I−, or Br−. Variances (top) and means (middle) of current records (n = 150) are shown for standard voltage protocols incorporating a prepulse to +60 mV followed by a 70-ms test pulse to −140 mV. (bottom) Variance–mean current plots are fitted with parabolas according to the equation: σ2 = σ0 2 + iI − I 2/n, where σ0 2 is baseline noise variance, i is single channel current, I is mean current, and n is number of channels. The results shown were obtained from a single patch. Fitted values for the parabolas shown are: (A) for chloride, i = 0.26 pA; (B) for nitrate, i = 0.1 pA; (C) for 50% iodide/50% chloride, i = 0.077 pA; (D) for bromide, i = 0.21 pA.

