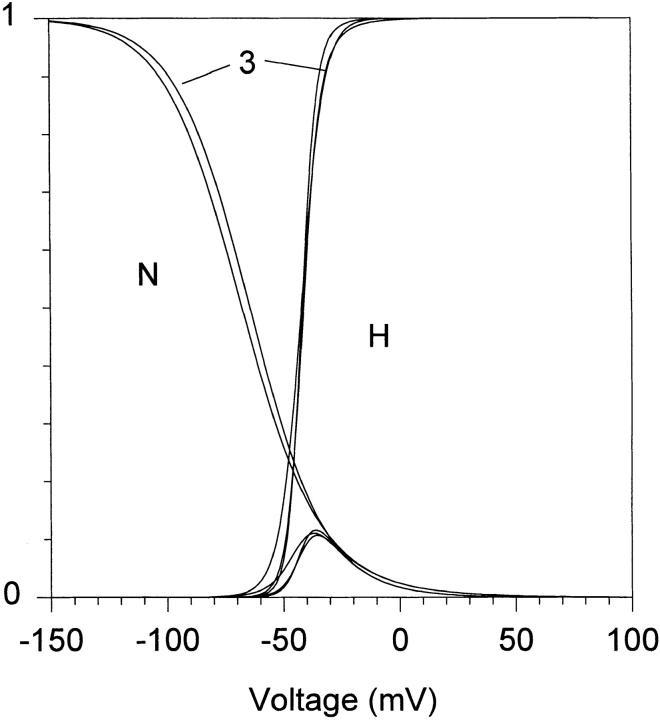
Figure 1.
Simulation of steady state inactivation, activation, and deactivation predicted by the three kinetic schemes. The curves that decline with depolarization represent the proportion of channels (N) that at steady state are open, in the absence of inactivation. The curves that ascend represent the proportion of channels (H) that at steady state are not in inactivated (Cs states), and are available to open. The bell-shaped curves, which are significant between −50 and +20 mV, represent the steady state open probability that is manifested as window current. The lines leading from the numeral 3 point to curves predicted by Scheme SIII.

