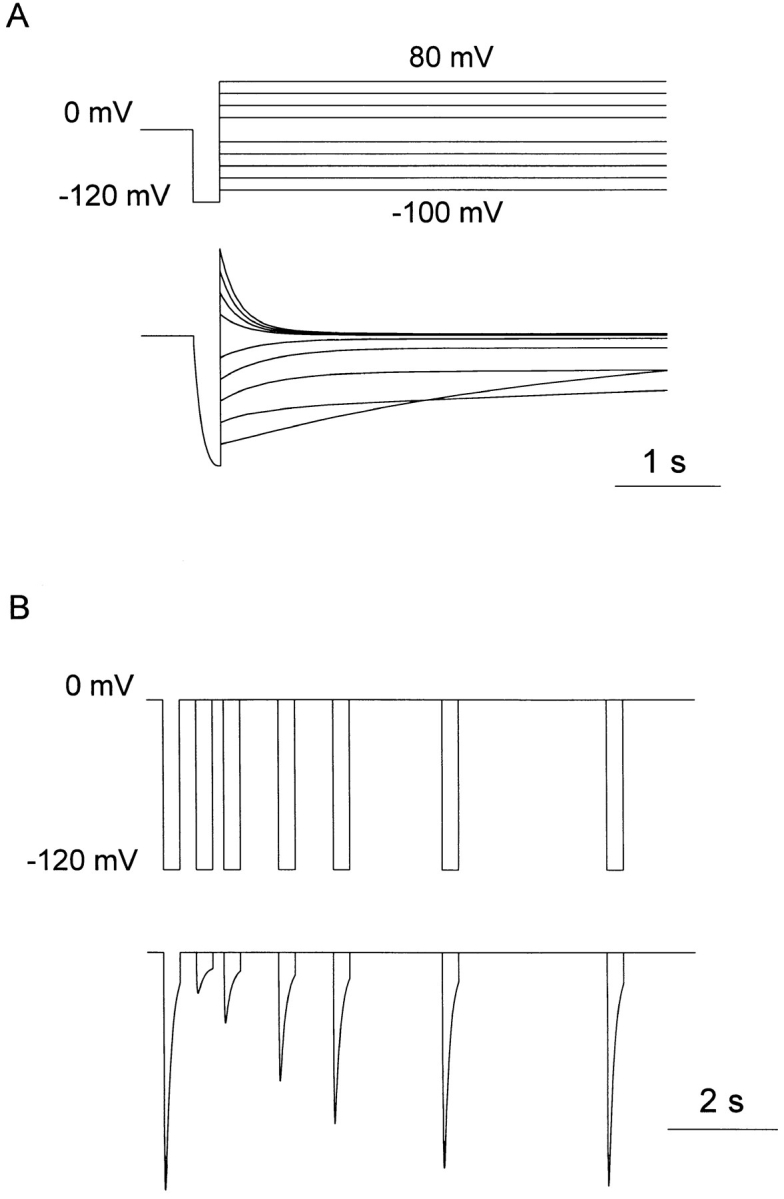
Figure 2.

(A) Simulation of the experiment illustrated in Fig. 5 A of Zhou et al. (1998). A brief 25-ms step from a holding potential of 0 to −120 mV is followed by 500-ms steps to test potentials that increased in 20-mV increments from −100 to +80 mV (omitting 0 mV). (B) Simulation of the experiment illustrated in Fig. 7 of Zhou et al. (1998). A 300-ms step from 0 to −120 mV is followed at increasing intervals by an identical test step. The recovery of the response to the second step reflects recovery from inactivation.
