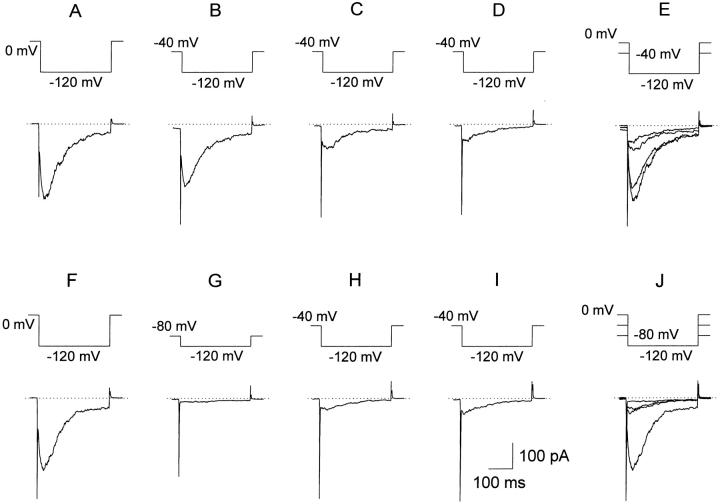
Figure 4.
History dependence of the availability of current. Currents recorded during test pulses to −120 mV from different Vhold (as labeled) are plotted in the order obtained. When Vhold was 0 mV (A) or more positive, the conductance was fully available (i.e., the test current was maximal). 1 min after Vhold was changed from 0 to −40 mV, the current during the first test pulse was still large (B), but the current during two subsequent test pulses, each after a 30-s interval, was attenuated greatly (C and D). Returning Vhold to 0 mV for 1 min fully restored the test current (F). Shifting Vhold to −80 mV for 30 s reduced the availability of channels to near zero (G). When Vhold was then changed to −40 mV, the test current after 1 min was still quite small (H). After a further 30 s, the test current had increased slightly (I) and was similar to the test current in D. Thus, equilibration of the system at −40 mV requires well over 1 min if no pulses are applied to open the channels. The capacity transient at the end of the test pulses has been truncated. In E and J, the four records in the corresponding row are superimposed.

