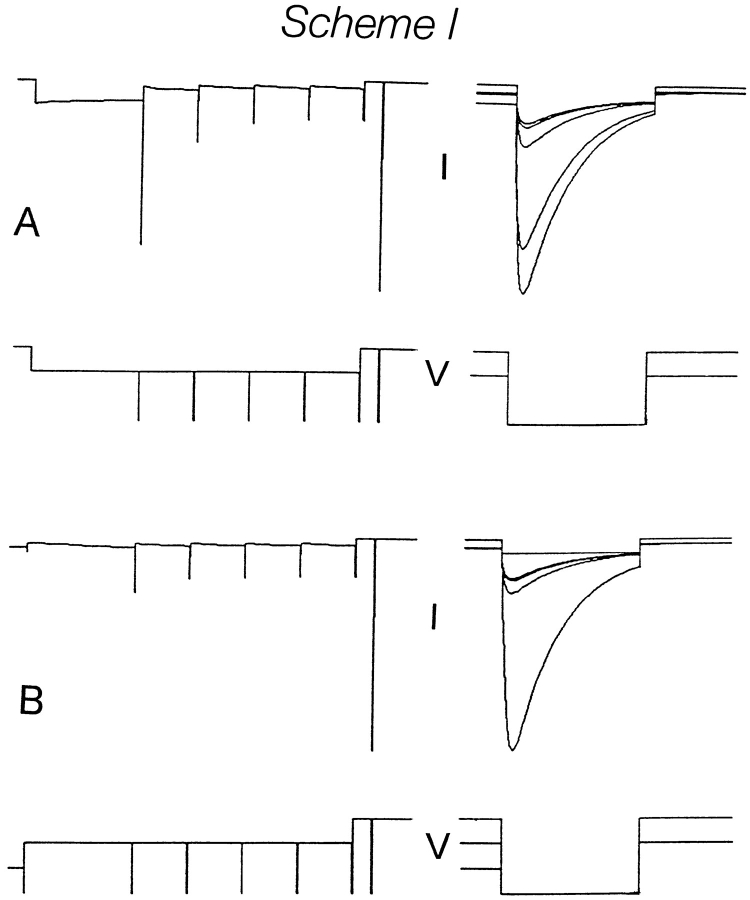
Figure 5.
Simulation of history dependence of availability. Scheme SI predicted results (A and B) that were quite similar to those shown in Fig. 4, E and J, respectively. On the left, the full protocol is shown, while on the right the responses to the test pulses are superimposed and plotted on an expanded time base. The voltage commands are plotted below the current traces. In A, Vhold = 0 mV. After a 60-s step to −40 mV, availability is tested by a 300-ms step to −120 mV. This test step is repeated four times at 30-s intervals. The membrane voltage is then returned to 0 mV, and 10 s later a command to −120 mV measures maximal availability. In B, Vhold = −80 mV. Again, after 60 s at −40 mV, availability is tested by a 300-ms step to −120 mV, which is repeated four times at 30 s intervals. The membrane voltage is then returned to 0 mV, and 10 s later a command to −120 mV measures maximal availability.

