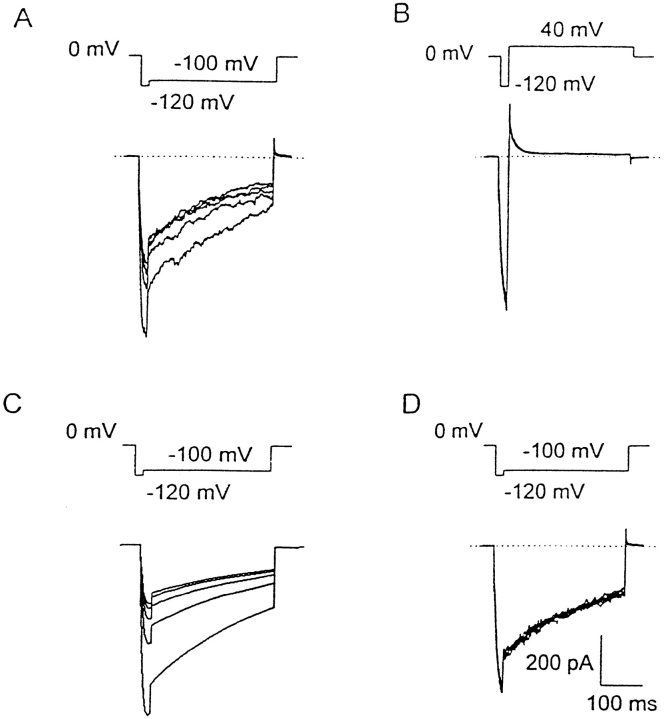
Figure 6.
Use-dependent inactivation. A voltage pulse protocol (above each set of records) like that used to elicit tail currents in Fig. 2 A (and Fig. 5 A in Zhou et al., 1998) was repeated and the first five current records are plotted. With a test pulse to 100 mV repeated at 0.91 Hz, there was substantial accumulation of inactivation (A). This result is qualitatively mimicked in our simulations (C ). When the rapid 0.91-Hz rate was used with a test pulse to +40 mV, no accumulation of inactivation was observed (B). In D, the voltage protocol in A was repeated at a slower rate (0.1 Hz) and no build up of inactivation was observed. This result was also mimicked by simulations using Scheme SI (not shown). The calibration bars in D also apply to A and B.

