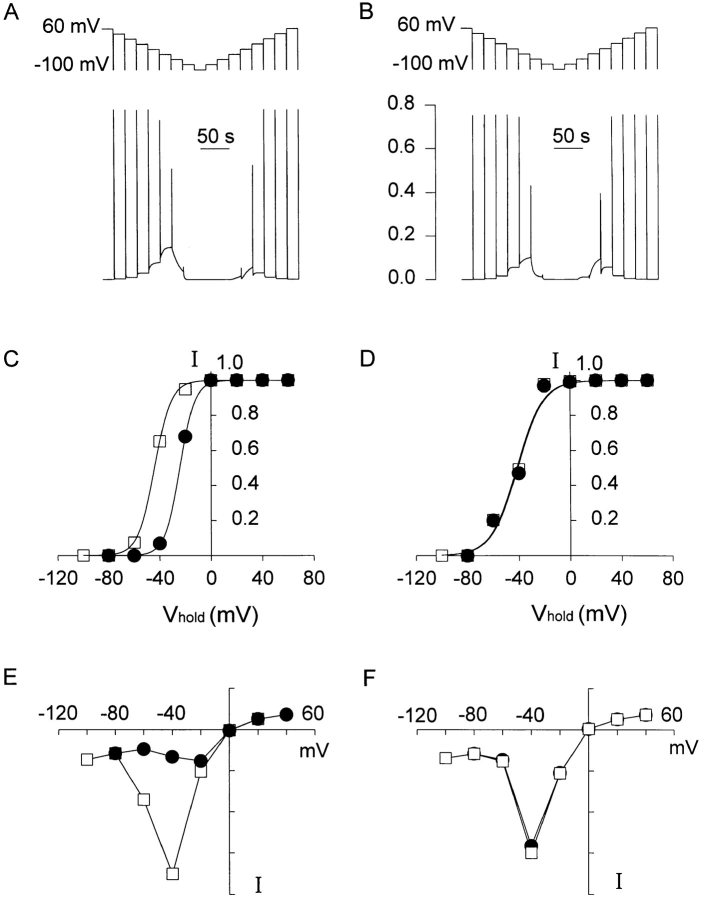
Figure 7.
Simulation of hysteresis in measurement of quasi– steady state inactivation and window currents (Fig. 4 of Zhou et al., 1998) using Schemes I and III. The entire experimental voltage pulse sequence is condensed (top), and the calculated responses for Schemes I and III are plotted in A and B, respectively. The responses to the test pulses are plotted in the positive direction as open probabilities rather than inward currents, as in the real data. The smaller, slowly changing current between these responses gives rise to the “window” current. (C) The peak open probabilities “measured” in the simulated experiment in A are plotted in the same way the real data were plotted (Fig. 4 C of Zhou et al., 1998). In the illustrated sequence in A, Vhold was initially 40 mV and was made progressively more negative (□). The reverse sequence in which Vhold was made progressively more positive, starting as −80 mV, is also shown (•). The curves show Boltzmann fits, with fitted parameters V 1/2 = −44.1 mV and k = 6.56 mV (□), and V 1/2 = −24.4 mV and k = 5.89 mV (•) for Scheme SI. (D) The analogous simulated data plotted for Scheme SIII, with V 1/2 = −41.6 mV and k = 10.1 mV (□), and V 1/2 = −40.8 mV and k = 10.1 mV (•). (E) Window currents (in arbitrary units) generated by Scheme SI, measured after 20 s at each Vhold just before the test pulse was applied. A linear leak current was added to resemble that in the experiment in Fig. 4 D of Zhou et al. (1998). (F) The window currents generated by Scheme SIII exhibit almost no hysteresis.

