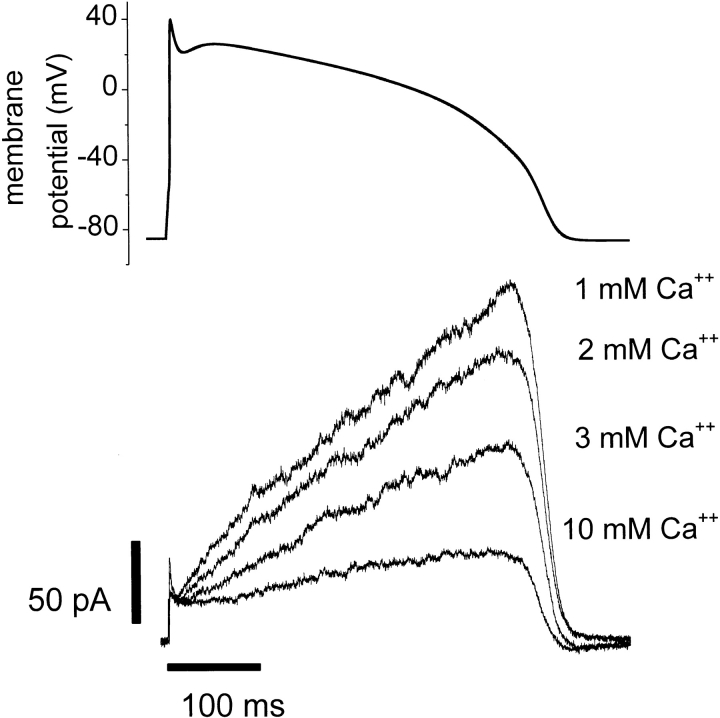
Figure 9.
A voltage clamp waveform in the shape of a ventricular action potential (A) was applied to a HERG expressing CHO-K1 cell at 25°C. The waveform was computed from a published model (Beeler and Reuter, 1977). Superimposed K+ current traces measured in 1–3 or 10 mM extracellular Ca2+ from a single cell are shown in B. Each trace represents the average of five whole cell voltage clamp sweeps in each condition. Similar results were obtained in two other cells.

