Figure 2.
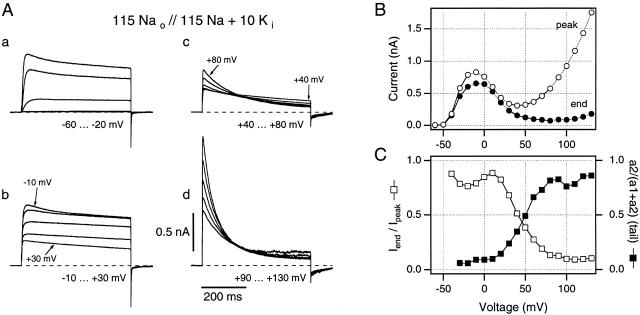
A family of macropatch currents recorded from ShΔ channels expressed in Xenopus oocytes, using a high [Na+], low [K+] internal solution. (A, a–d) Individual current traces are shown for groups of five test potentials to minimize the ambiguity produced by overlapping traces. (B) Peak current magnitudes (○) give an N-shaped peak I-V curve, while end currents (•) fail to increase at potentials greater than +20 mV, indicating steadily increasing slow inactivation in this 500-ms time window at these test potentials. (C) Iend/I peak (□) and the relative increase in magnitude of slow component of the tail current (▪) are plotted against the test potential to give quantitative estimates of steady state slow inactivation at these potentials. Symbols in B and C are connected by straight lines. All data are from the same inside-out patch as in Fig. 1 C. Traces recorded using 5-s interpulse intervals.

