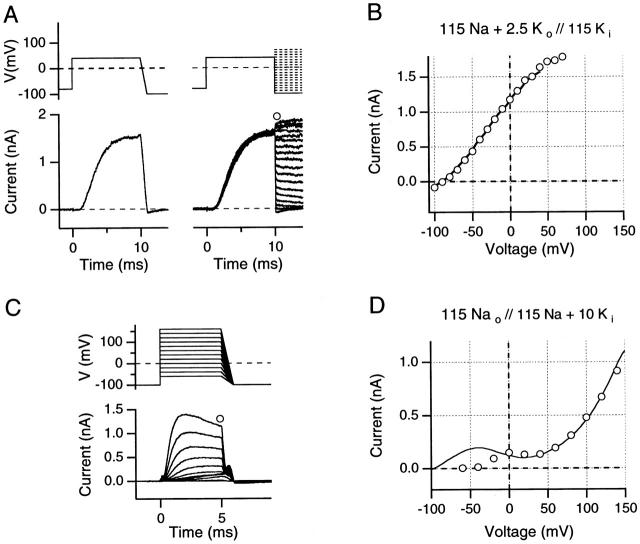
Figure 4.
(A and B) Comparison of instantaneous I-V curves and reversal potentials obtained from 1-ms ramps and by the standard tail current method, evaluated in high internal K+ solution (A, top) The pulse protocols illustrate the 1-ms downward ramps from +40 as well as corresponding protocols for the recording of instantaneous tail currents. (Bottom) Ionic currents obtained from an outside-out patch using solutions indicated in B. Data were recorded with a sample interval of 10 μs, digitally low-pass filtered at 20 kHz. (B) Comparison of ramp I-V data from +40 mV to −100 mV (solid line) with instantaneous tail current I-V data (○) from the data shown in A. (C and D) Comparison of instantaneous I-V curves from 1-ms ramps with the N-shaped test pulse I-V curve, evaluated in a high internal Na+ solution with 10 mM added K+. (C, top) The pulse protocols are indicated; note that in low internal K+ concentration, yielding faster inactivation, short (5-ms) depolarizing pulses were used. All records were leak- and capacitative-current subtracted using on-line −P/n pulses. (Bottom) Ionic currents obtained from an inside-out patch using the solutions indicated in D. (D) Comparison of ramp I-V data from +160 to −100 mV (solid line) with test pulse peak current I-V data (○) from the data shown in C. Note the N-shaped I-V curve for both the ramp and the test pulse I-V curves. All data were obtained using 5-s interpulse intervals.

