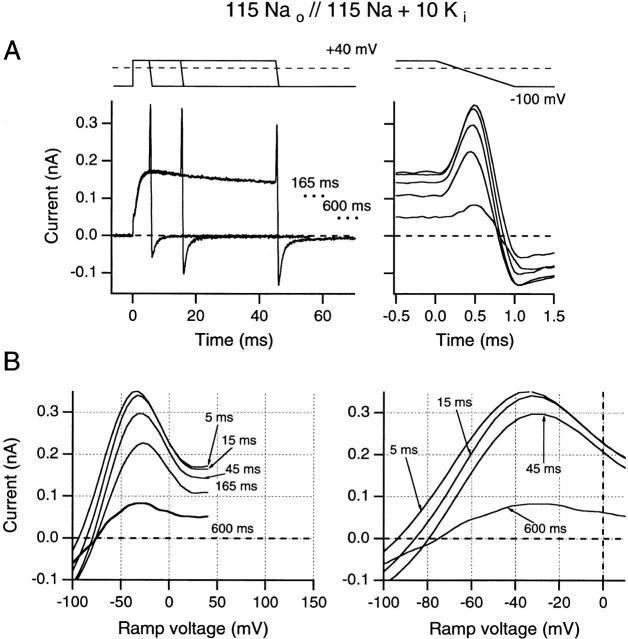
Figure 5.
Effects of increasing test pulse duration on ramp I-V curves recorded following test pulses to +40 mV. Ramp currents are plotted against time (A) and against the ramp potential (B). Solutions were identical to those used in Fig. 4 B. (A, left) Superimposed data traces for 5-, 15-, and 45-ms test-pulse durations. End current levels for 165 and 600 ms are indicated by dots. (Right) The same ramp currents superimposed and aligned with the voltage record (top trace). (B, left) Ramp currents after test pulses shown in A are plotted against ramp voltage (from +40 to −100 mV). (Right) An expanded voltage scale is used to illustrate changes in reversal potential. All data were obtained from one inside-out patch using 5-s interpulse intervals.

