Figure 8.
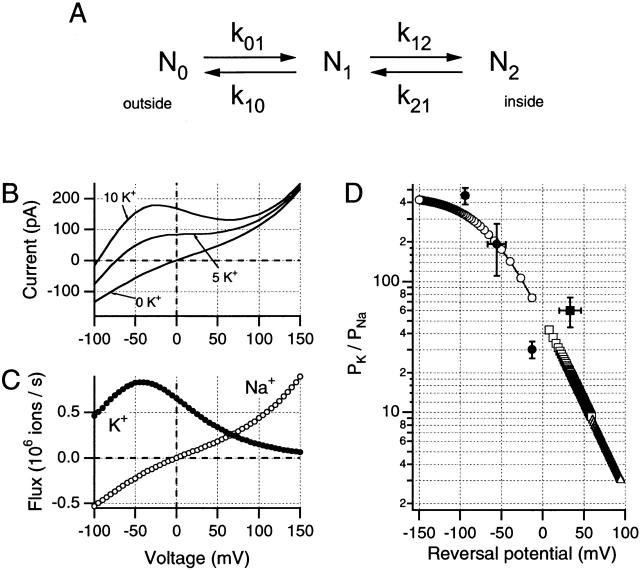
A simple single-site Eyring barrier model can be used to demonstrate voltage-dependent changes in P K/P Na ratio. Parameters of the model used here can be described in relation to a simple kinetic scheme (A) in which N0, N1, and N2 represent the external, intramembrane, and internal energy wells, respectively; where k 01 and k 10 are the forward and backward rate constants between N0 and N1, and k 12 and k 21 are the equivalent rate constants between N1 and N2. Values for these rate constants are shown given for both Na+ and K+ ions at 0 mV and the solutions used for the data in Fig. 7 A. Rate constants (s−1): (Na+) k 01, 2.77 × 10+8; k 10, 1.13 × 10+5; k 12, 2.05 × 10+8; k 21, 5.01 × 10+11; (K+) k 01, 1.84 × 10+11; k 10, 4.57 × 10+8; k 12, 6.18 × 10+7; k 21, 2.49 × 10+11. To calculate the rate constants at other potentials, it is necessary to define the placements of the barriers and wells within the transmembrane field. For the model used here, N0 and N2 were presumed to be at 0 and 100% of the electrical distance from the external side of the membrane, while N1 was set at 45% of this distance. Internal and external energy barriers were placed at 10 and 90% of the transmembrane field, respectively. (B) Simulations of changes in internal K+ concentrations approximate the data shown in Fig. 7 A, when the same internal and external solutions are used. For this simulation, the patch was presumed to contain 1,500 channels. (C) Predicted single-channel Na+ and K+ fluxes were generated by this model for the 10-mM internal K+ condition, suggesting voltage-dependent changes in relative permeabilities. (D) P K/P Na ratios obtained from predicted reversal potentials for this model under different ionic conditions. (○) Simulations with 115 Nao//115 Nai and differing internally, (□) variable external [K+]. ▵ were obtained from simulations using internal 11.5 mM Na+, external 115 mM Na+, and variable K+. Experimental values obtained in this study are shown as filled symbols (mean ± SD): •, Na+ o//Na+ i + variable K+; ▪, Na+ o + 2.5–10 mM K+ o//Na+ i.

