Figure 12.

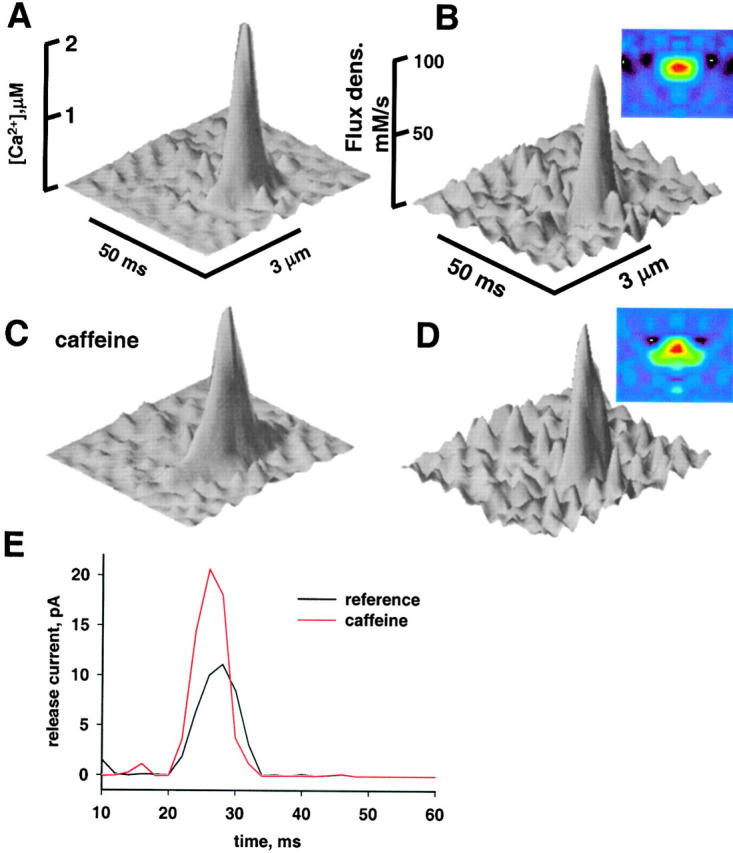
Effect of caffeine on the calculated release flux and current. (A) “Calcium transient” {[Ca2+](x,t)} calculated for the average of sparks in reference illustrated in Fig. 6 A (images before caffeine and after washout, rise times restricted to the range 5.1–6.9 ms). (B) Ca2+ release flux density, for the top view in color the horizontal span is 3 μM and the vertical is 30 ms). (C and D) Corresponding waveforms for the average of events in caffeine. Note widening of Ca2+ transient and release flux, without change in flux density. (E) Release current, computed by volume integration of flux density. Computations were carried out as described by Ríos et al. 1999, with parameter values listed in their Table (I).
