Figure 10.
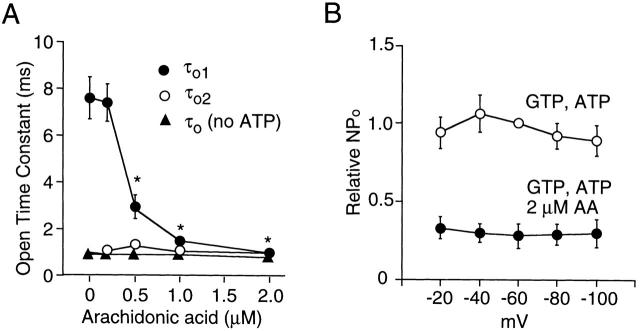
Effect of AA on open time constants and on the membrane potential–dependent effect on channel activity. (A) Open-time constants were calculated from the transition rates determined from Fig. 9 as described in materials and methods and plotted as a function of [AA]. *Significant difference from the value obtained without AA (P < 0.05). (B) Channel activity was determined at different membrane potentials. The value at −60 mV was taken as 1.0 (GTP + ATP). Each point is the mean ± SEM of four determinations.

