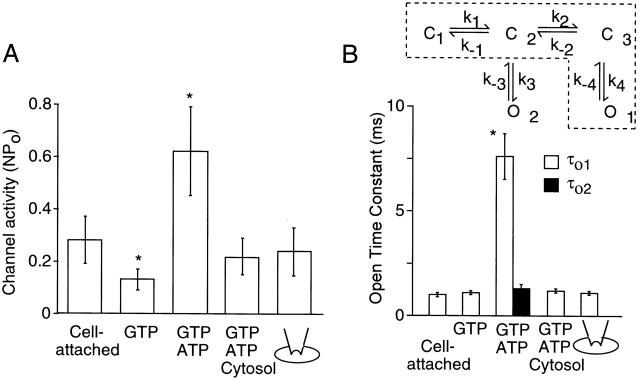
Figure 2.
Summary data showing the effect of ATP and cytosolic fraction on channel activity and open time constants. (A) Channel activity (NPo) was determined at various patch conditions. (B) Open time constants were calculated from the rate constants (τo1 = 1/k −4 and τo2 = 1/k −3) obtained by fitting the data to the two kinetic schemes. The kinetic scheme in dotted lines was used to analyze channel kinetics when currents were recorded with GTP or cytosolic fraction. 5 mg/ml protein cytosolic fraction was used for all experiments. Each bar shows the mean ± SD of four values. *Significant difference from the value of the first bar (P < 0.05).

