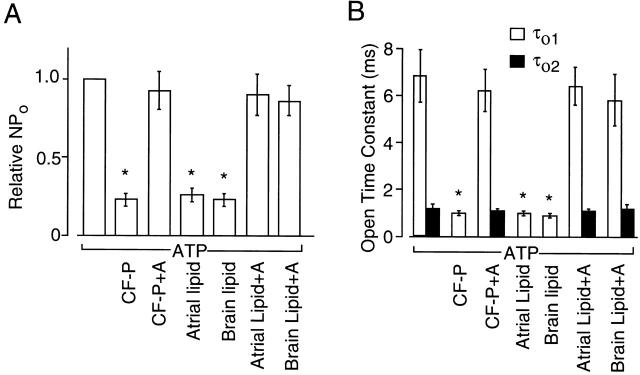
Figure 5.
Summary data showing the effect of atrial and brain cytosolic fractions and the chloroform-extracted lipid fraction on KACh channel activity (A) and open time constants (B). CF-P indicates protease-treated cytosolic fraction, and A indicates fatty acid–free albumin. Open time constants were calculated from the rate constants that were determined by fitting the single channel data to the kinetic schemes shown in Fig. 2 B using the QuB analysis. Each bar shows the mean ± SD of four determinations. *Significant difference from the value of the first bar (P < 0.05).

