
Figure 2.
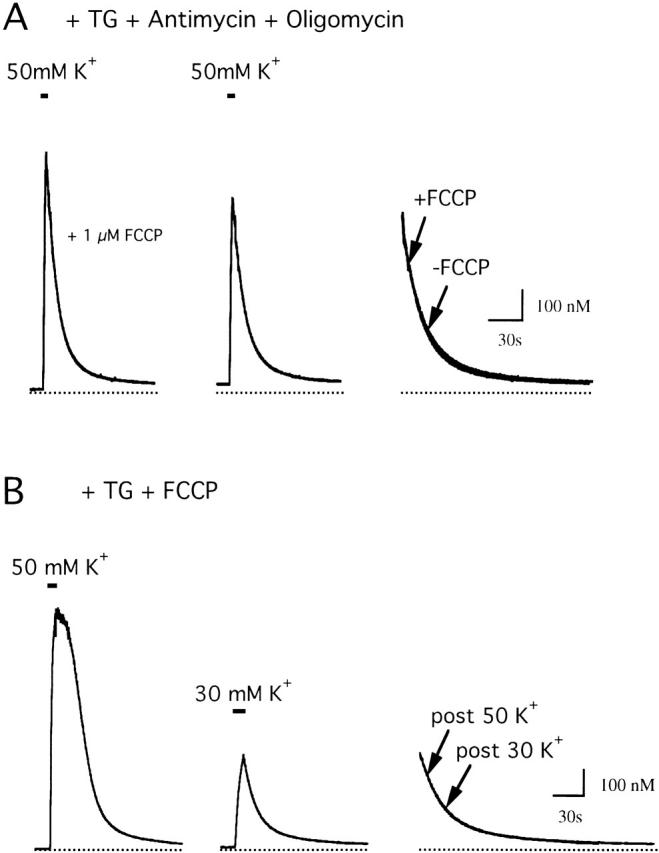
Characterization of the FCCP-resistant flux. (A) FCCP has little effect after inhibition of mitochondrial Ca2+ transport. [Ca2+]i responses were evoked by depolarization in the presence of antimycin A1 (1 μM), oligomycin (1 μg/ml), and 1 μM FCCP (left), and then after washing out FCCP (center). FCCP did not alter the kinetics of the recovery, as shown by superimposing the recoveries on an expanded time scale (right). Cell sc0d79. (B) JFCCP-res is defined by [Ca2+]i at each time during the recovery. Responses to 50 mM K+ (left) and 30 mM K+ (center) elicited in the presence of 1 μM FCCP. Although the recoveries follow very different [Ca2+]i histories, they are essentially identical over the common range of [Ca2+]i; superimposed recoveries are shown on an expanded time scale (right). Cell sc0c67.