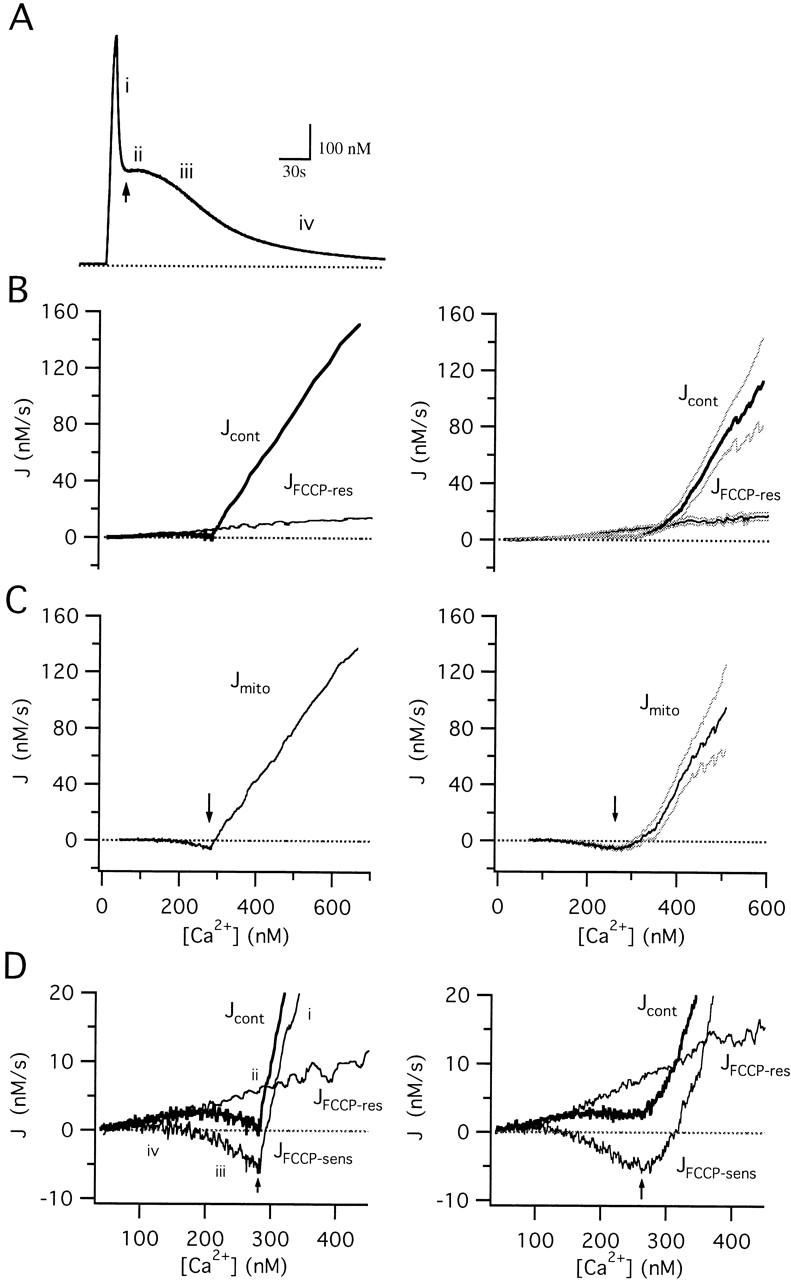
Figure 3.

Separation of the total Ca2+ flux during the recovery into mitochondrial and nonmitochondrial components. (A) [Ca2+]i response elicited by exposure to 50 mM K+, illustrating the four phases of recovery (i–iv). Arrow indicates the [Ca2+]i plateau. Cell sc0c73. (B) [Ca2+]i dependence of the total Ca2+ flux (Jcont, thick trace) obtained by calculating −d[Ca2+]i/dt during the recovery in A and plotting against [Ca2+]i. The FCCP-resistant component of Jcont (JFCCP-res, thin trace) was determined in the same cell during exposure to FCCP (1 μM). Average fluxes from 10 cells are shown at right (± SEM indicated by light traces). (C) Jmito, calculated by subtracting JFCCP-res from Jcont at corresponding values of [Ca2+]i for the single cell (left) and collected results (right). Arrows indicate the [Ca2+]i plateau level. (D) Comparison between Jcont (thick trace) and its component fluxes Jmito and JFCCP-res (thin traces) on an expanded scale, showing that, while Jcont is small during the plateau phase, it is the sum of much larger component fluxes of opposite sign that have similar magnitudes. Right panel shows collected results.
