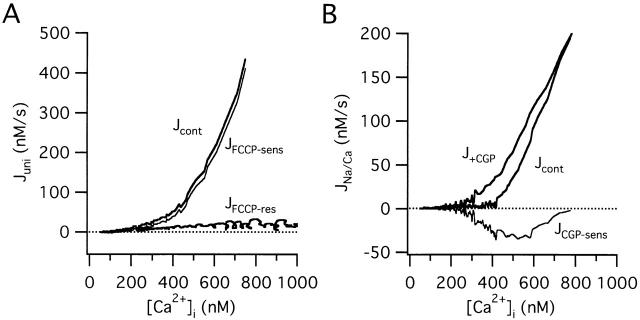
Figure 8.
Mitochondrial Ca2+ uptake and release fluxes measured under voltage clamp. (A) Fluxes measured from a representative cell under voltage clamp after depolarization from −70 to −10 mV with a Na+-free pipette solution, before (Jcont) and after exposure to 1 μM FCCP (JFCCP-res). The FCCP-sensitive flux (JFCCP-sens, thin trace), calculated as the difference between the total flux measured in the absence (Jcont) and presence of FCCP (JFCCP-res), is positive and increases steeply with [Ca2+]i, much like the CGP-resistant flux seen in cells after high K+ depolarization. Cell ma4980. (B) Flux measurements from another cell during the recovery after a step from −70 to −10 mV (pipette solution contained 6.5 mM NaCl) before and after exposure to CGP (1 μM). The CGP-sensitive flux (thin trace), calculated as the difference between the total flux in the absence and presence of CGP, is inward and biphasic, similar to JCGP-sens observed in cells depolarized with high K+. Cell sc0w21.

